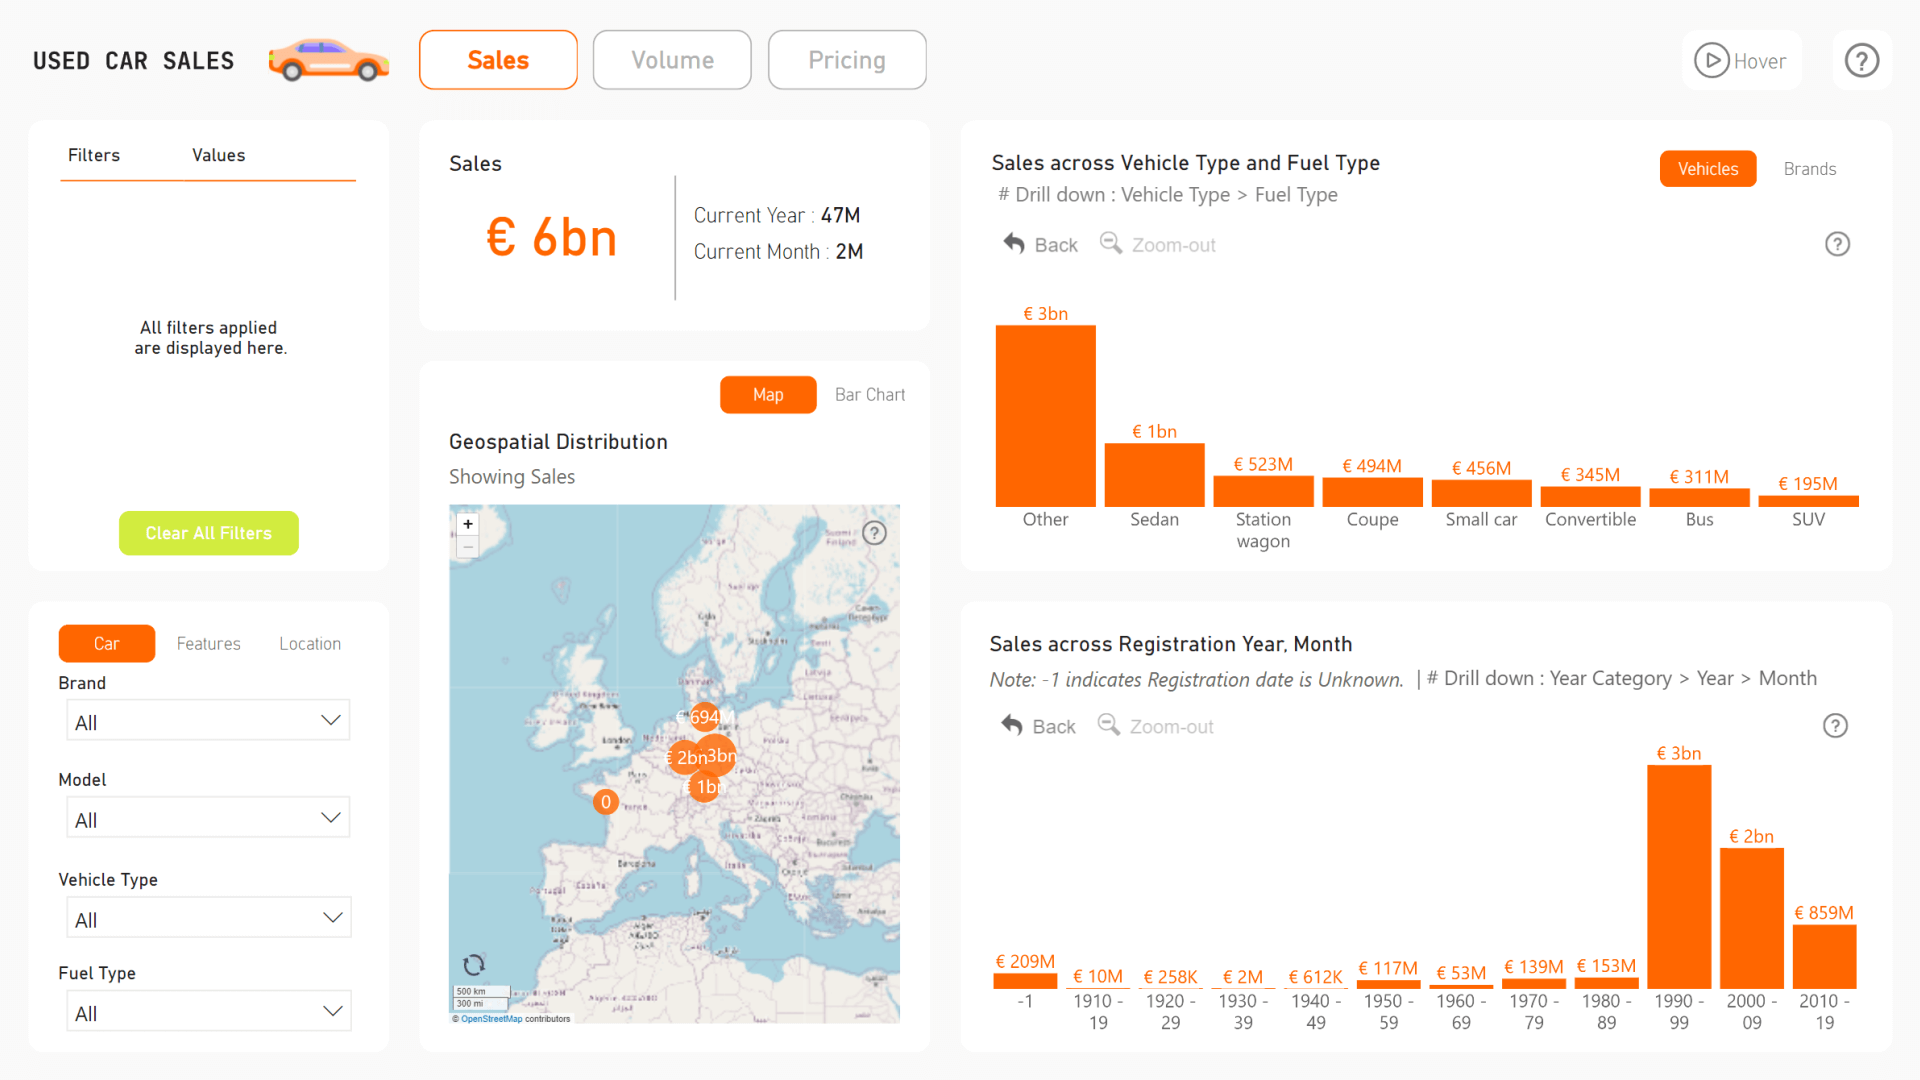
The report uses multiple interactive visuals to provide various insights about used car sales, including revenue or sales volume per car vehicle type, region, age, and other factors. Furthermore, the report can explore trends in average car prices.
How To Use This Report Template
To interact with this Power BI report, simply click any active elements directly on the charts.
Download this report to see all the settings, formulas, and calculations. Try it out with your own data by making a few adjustments.
Leave a Reply