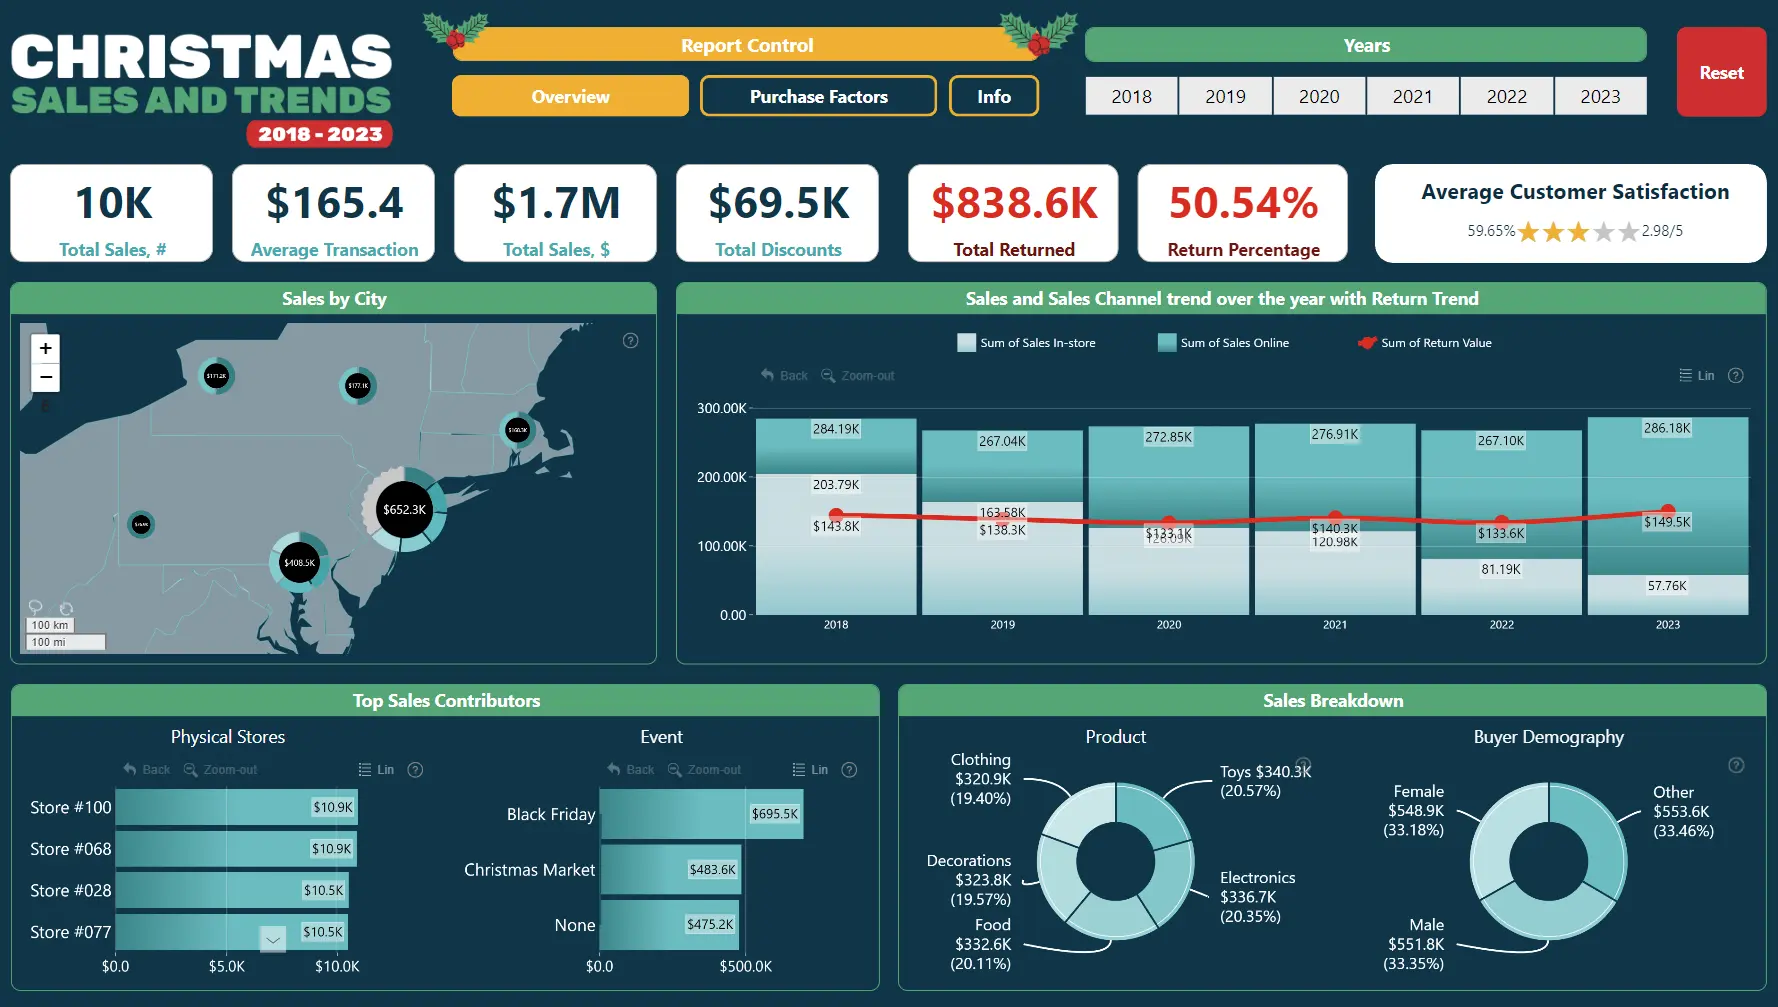
Across multiple visuals that dynamically cross-filter each other, this report allows the user to analyze the same data from multiple dimensions, including sales by city, product category, buyer demographic, and time of purchase. The second page reveals even more detailed insights, such as sales per payment type, shipping method, and even weather conditions.
How To Use This Report Template
To interact with this Power BI report, simply click any active elements directly on the charts. Download this report to see all the settings, formulas, and calculations. Try it out with your own data by making a few adjustments.
Leave a Reply