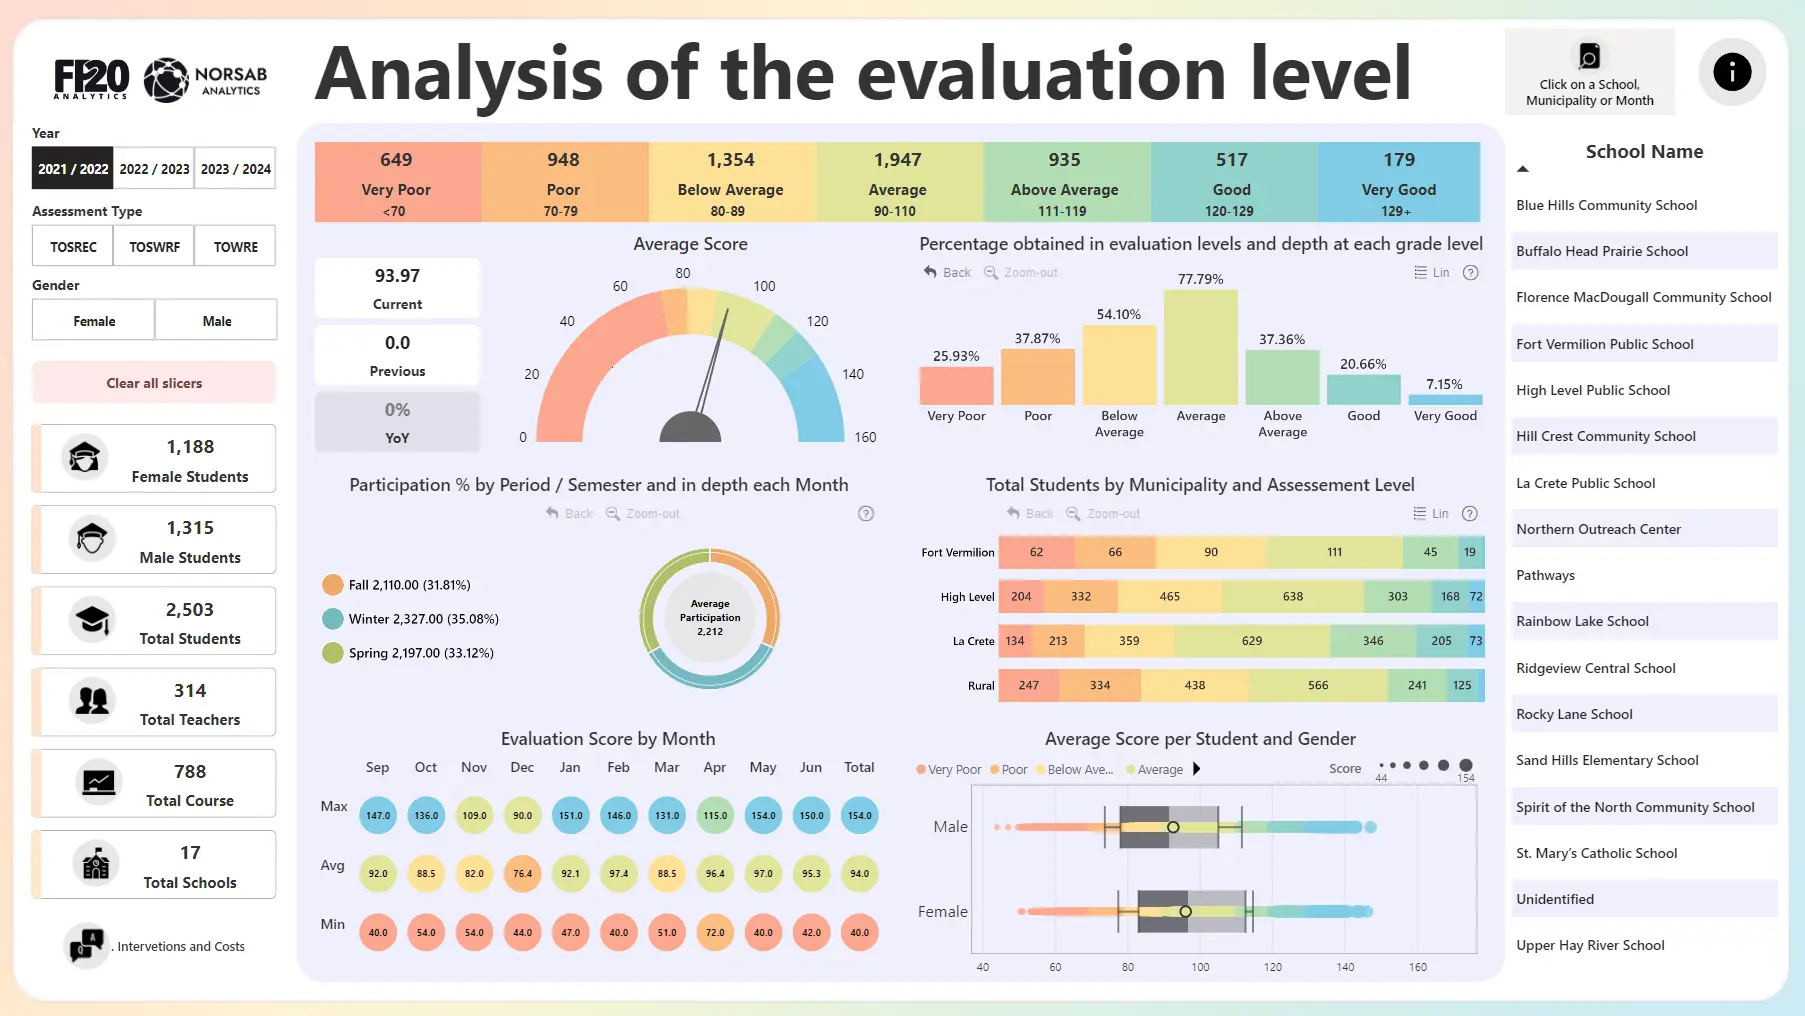
This school analytics Power BI report provides an all-encompassing overview in the initial view, while allowing the user to quickly and easily drill down for deeper insights with the use of thoughtfully placed slicers and cross-filtering visuals. This report is intuitive to use and easy to read, making data-driven education data analysis accessible even to users without a background in Power BI.
How To Use This Report Template
To interact with this Power BI report, simply click any active elements directly on the charts. Download this report to see all the settings, formulas, and calculations. Try it out with your own data by making a few adjustments.
Leave a Reply