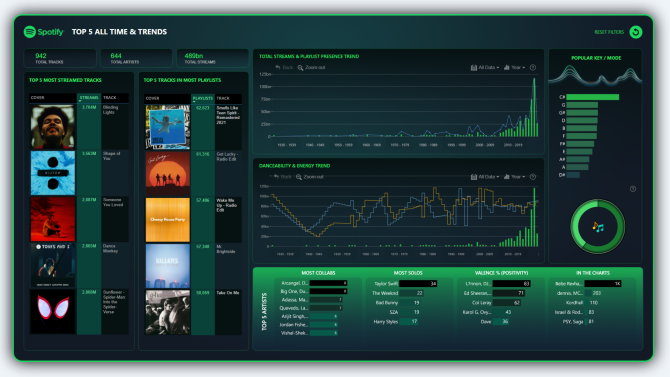
The report places a visual emphasis on the most listened artists and songs, supplementing it with insights on relation between music popularity and release date on a timeline chart, in addition to data about the most popular song keys, danceability, and other metrics.
How To Use This Report Template
To interact with this Power BI report, simply click any active elements directly on the charts.
Download this report to see all the settings, formulas, and calculations. Try it out with your own data by making a few adjustments.
Leave a Reply