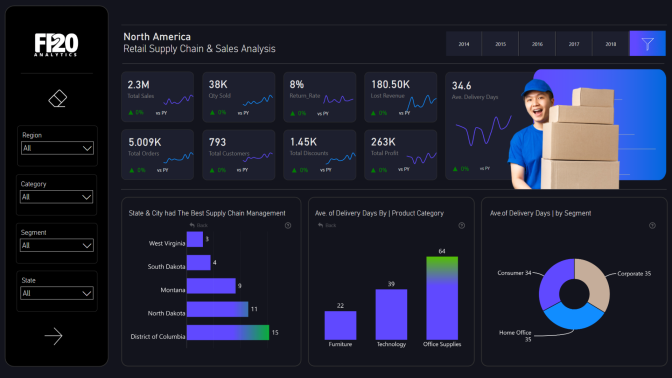
By combining a striking visual style that catches the user’s eye and a thoughtfully placed collection of KPI cards, this report instantly provides a comprehensive overview at the first glance. Data can be quickly filtered with the slicer panel on the left side, or by interacting with Drill Down Visuals. The second page contains additional insights.
How To Use This Report Template
To interact with this Power BI report, simply click any active elements directly on the charts.
Download this report to see all the settings, formulas, and calculations. Try it out with your own data by making a few adjustments.
Leave a Reply