Summary
This Power BI email communication analysis report will help you uncover valuable insights about internal comms and keep your finger on the pulse of your company. Spot trends and patterns, reveal the most active communication networks and perform sentiment analysis – all within one report!
Key Insights of This Report
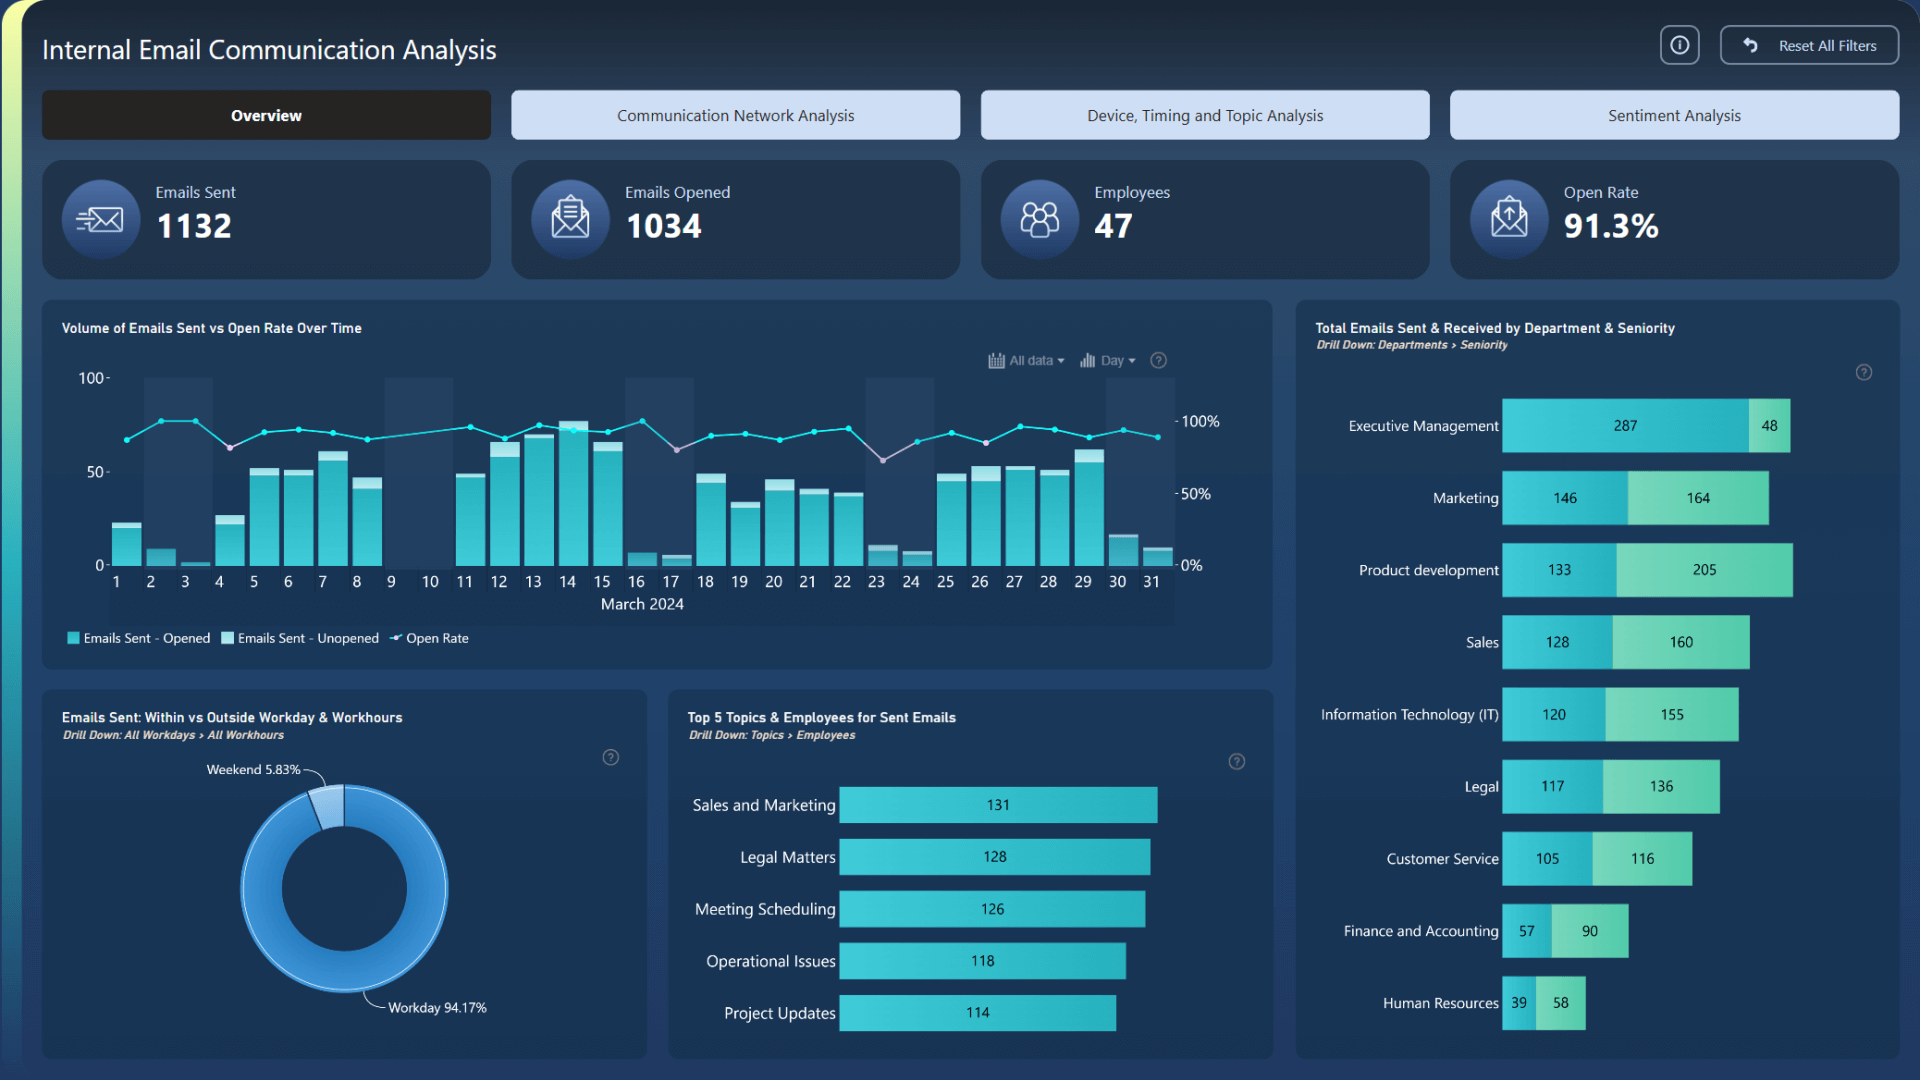
This report visualizes a corporate email dataset and reveals various insights to analyze internal communications. The main metrics include:
- Emails sent
- Open rate
- Time of sending / opening
- Senders and recipients (name, department, seniority)
- Email topics
- Email sentiment (positive, neutral, negative)
The report is neatly structured into four pages, and the interactive visuals can be used to quickly and easily find answers to various questions, such as “what are the most active dates or times”, “what’s the sentiment of each department and how did it change over time”, “who sends the most emails during the weekends”, and many more.
This data is visualized using interactive visuals, allowing users to drill down with just a click; and cross-chart filtering instantly shows relevant insights across the entire report page whenever the user selects data. Furthermore, the Graph PRO visual displays the entire communications network as an interactive graph, visualizing how employees or departments interact with each other.
Leave a Reply