Key Insights of Power BI Financial Analysis Dashboard
The report is structured in six pages. The initial view displays an overview, and each additional page allows user to delve deeper into more specific insights. Some of the main insights include:
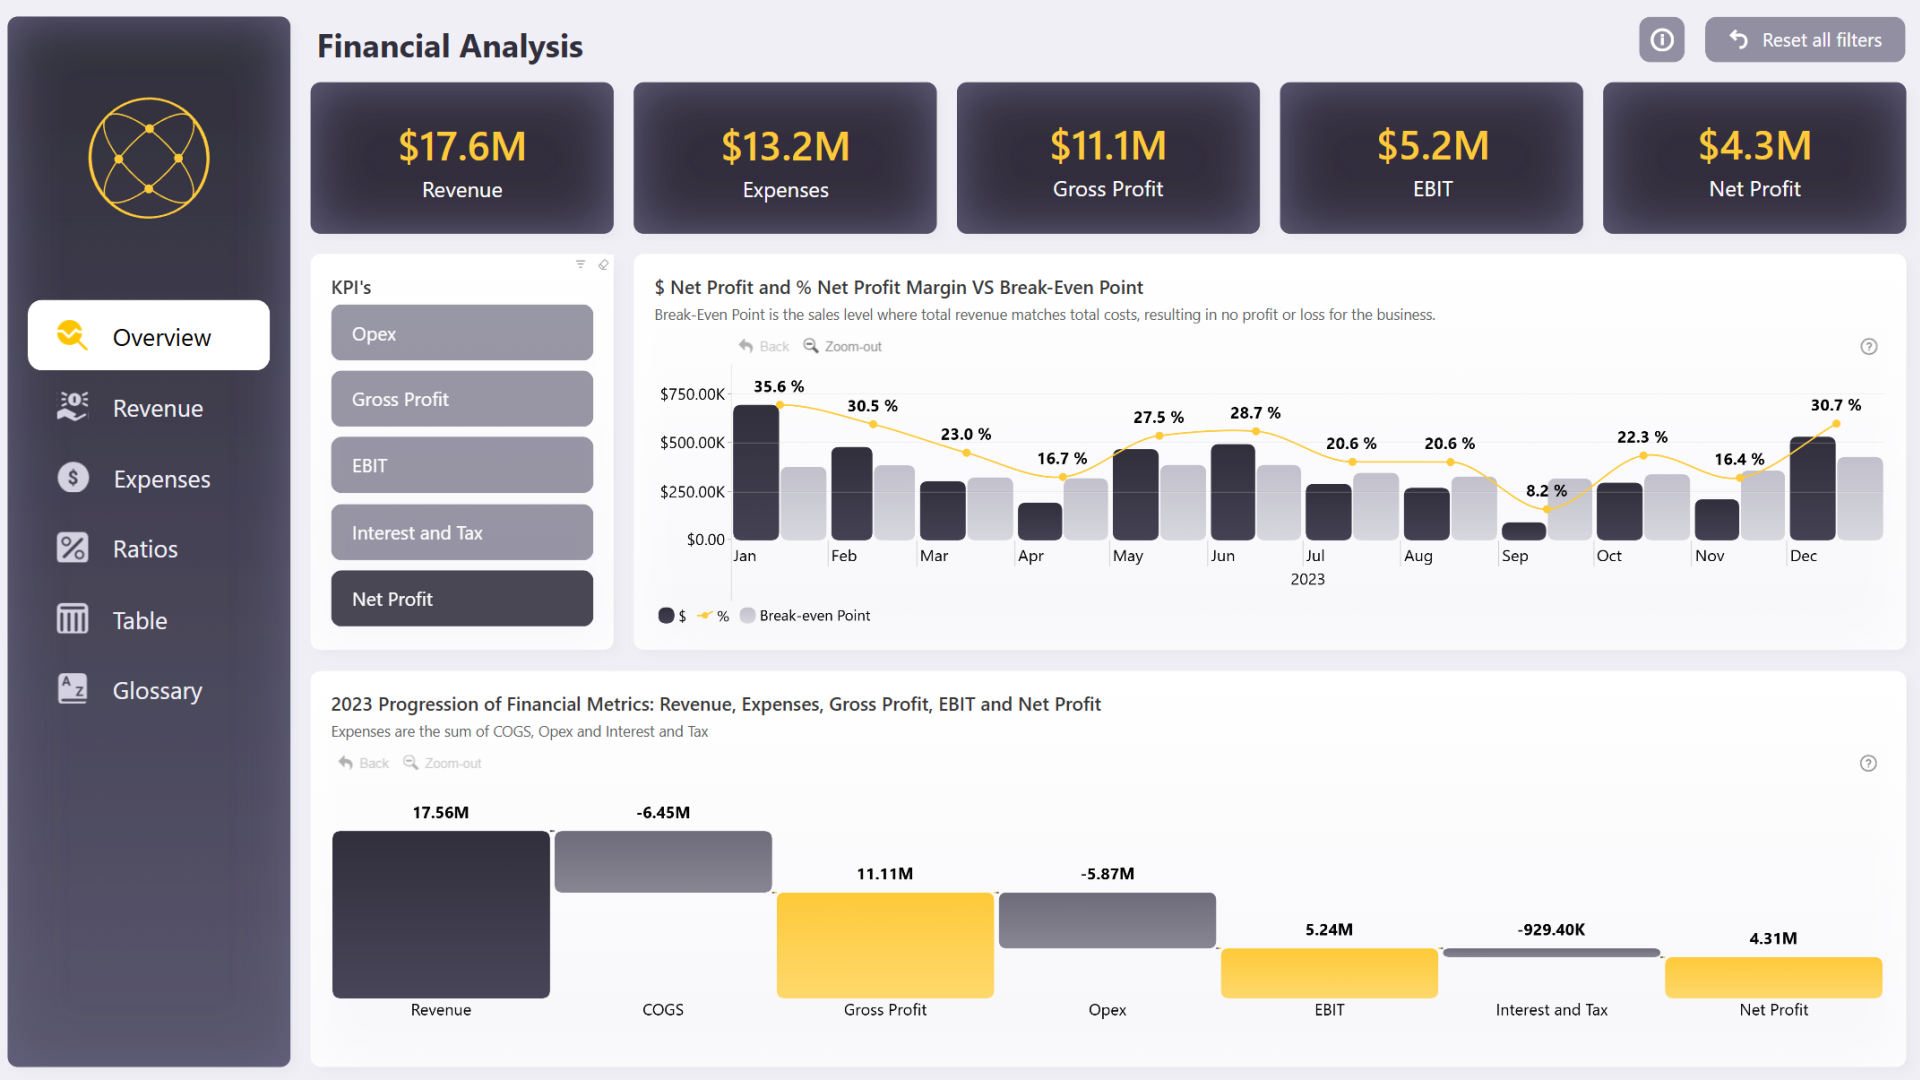
- Step-by-step progression from revenue to net profit
- Revenue: total; by category, by channel; changes over time
- Expenses: by type, by business line; changes over time
- Profit: changes over time, comparison vs. KPis
With a thoughtful design and clever use of visuals, this Power BI financial analysis dashboard makes it quick easy to find valuable insights. The interactive visuals work together to filter relevant data, allowing users to instantly analyze it from multiple perspectives.
Leave a Reply