Take your Power BI reporting to the next level with a vast library of free Power BI templates
Skip the hassle of building dashboards from scratch— our customizable Power BI dashboard templates come with easy-to-follow instructions for connecting your own data from various popular platforms in just a few clicks.
-
1 Power BI Banking Dashboard
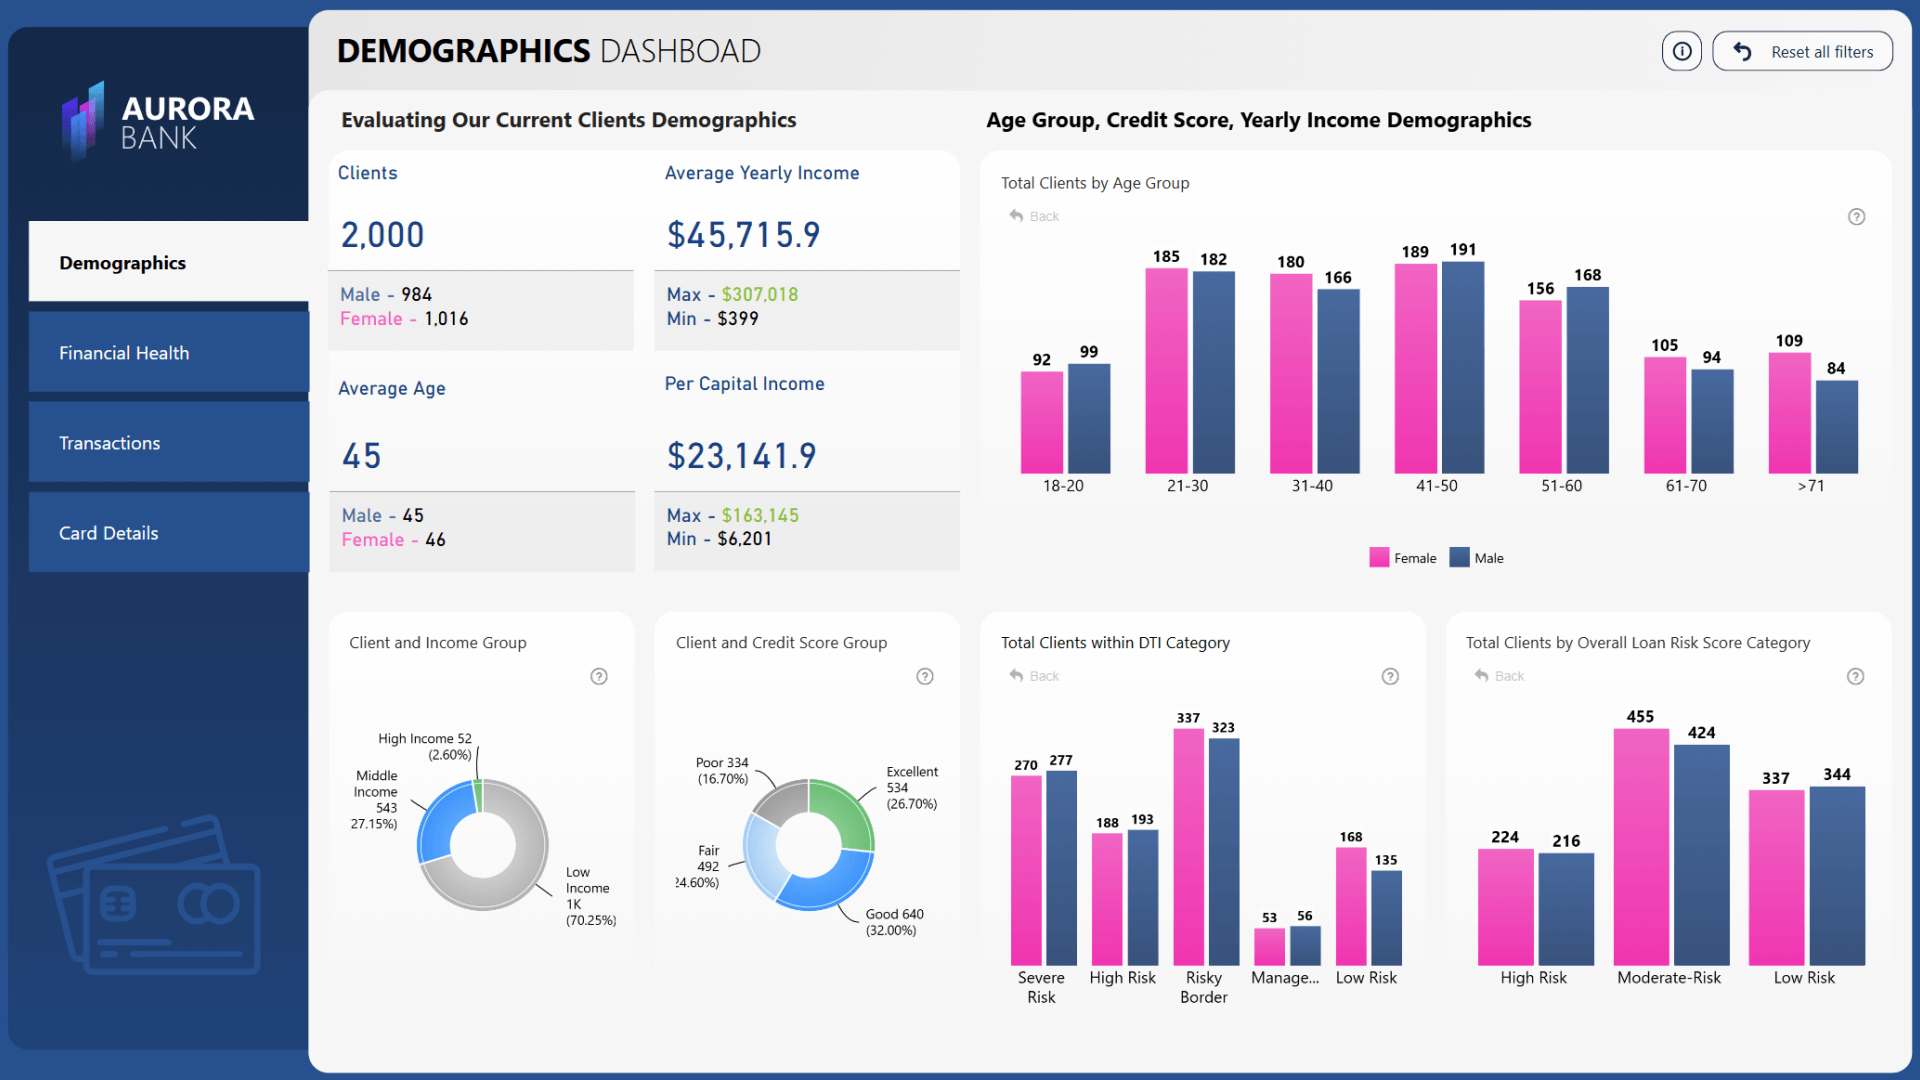
Power BI Banking Dashboard This Power BI banking dashboard can be used by banks or other financial institutions to analyze […]
-
2 Sales Customer Profile Report
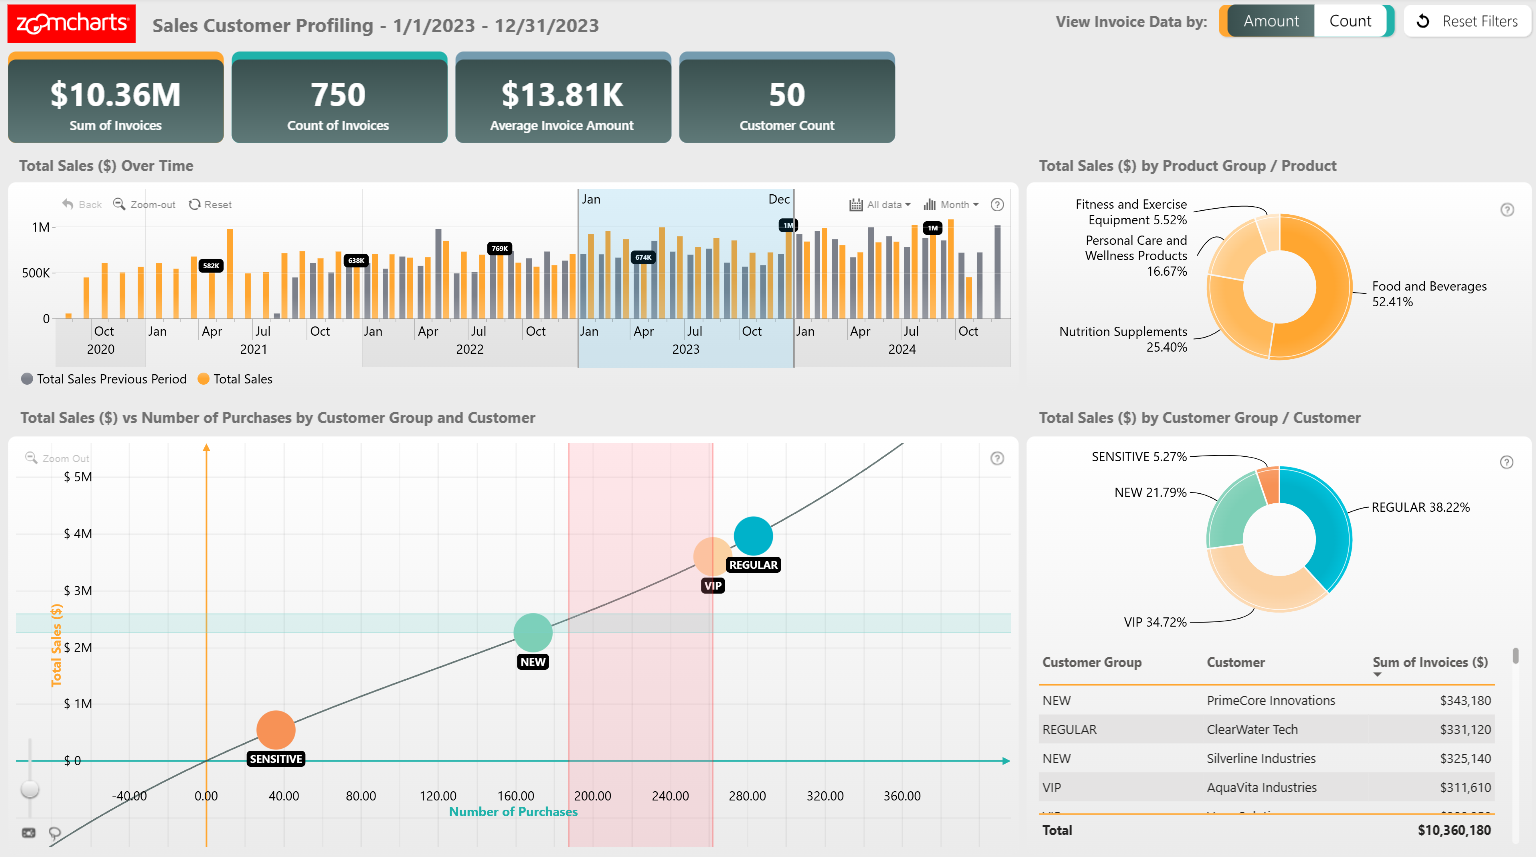
Sales Customer Profiling Report Gain a deeper understanding of your customer base with this Sales Customer Profiling Report, powered by Scatter PRO, […]
-
3 Power BI CRM Dashboard Example
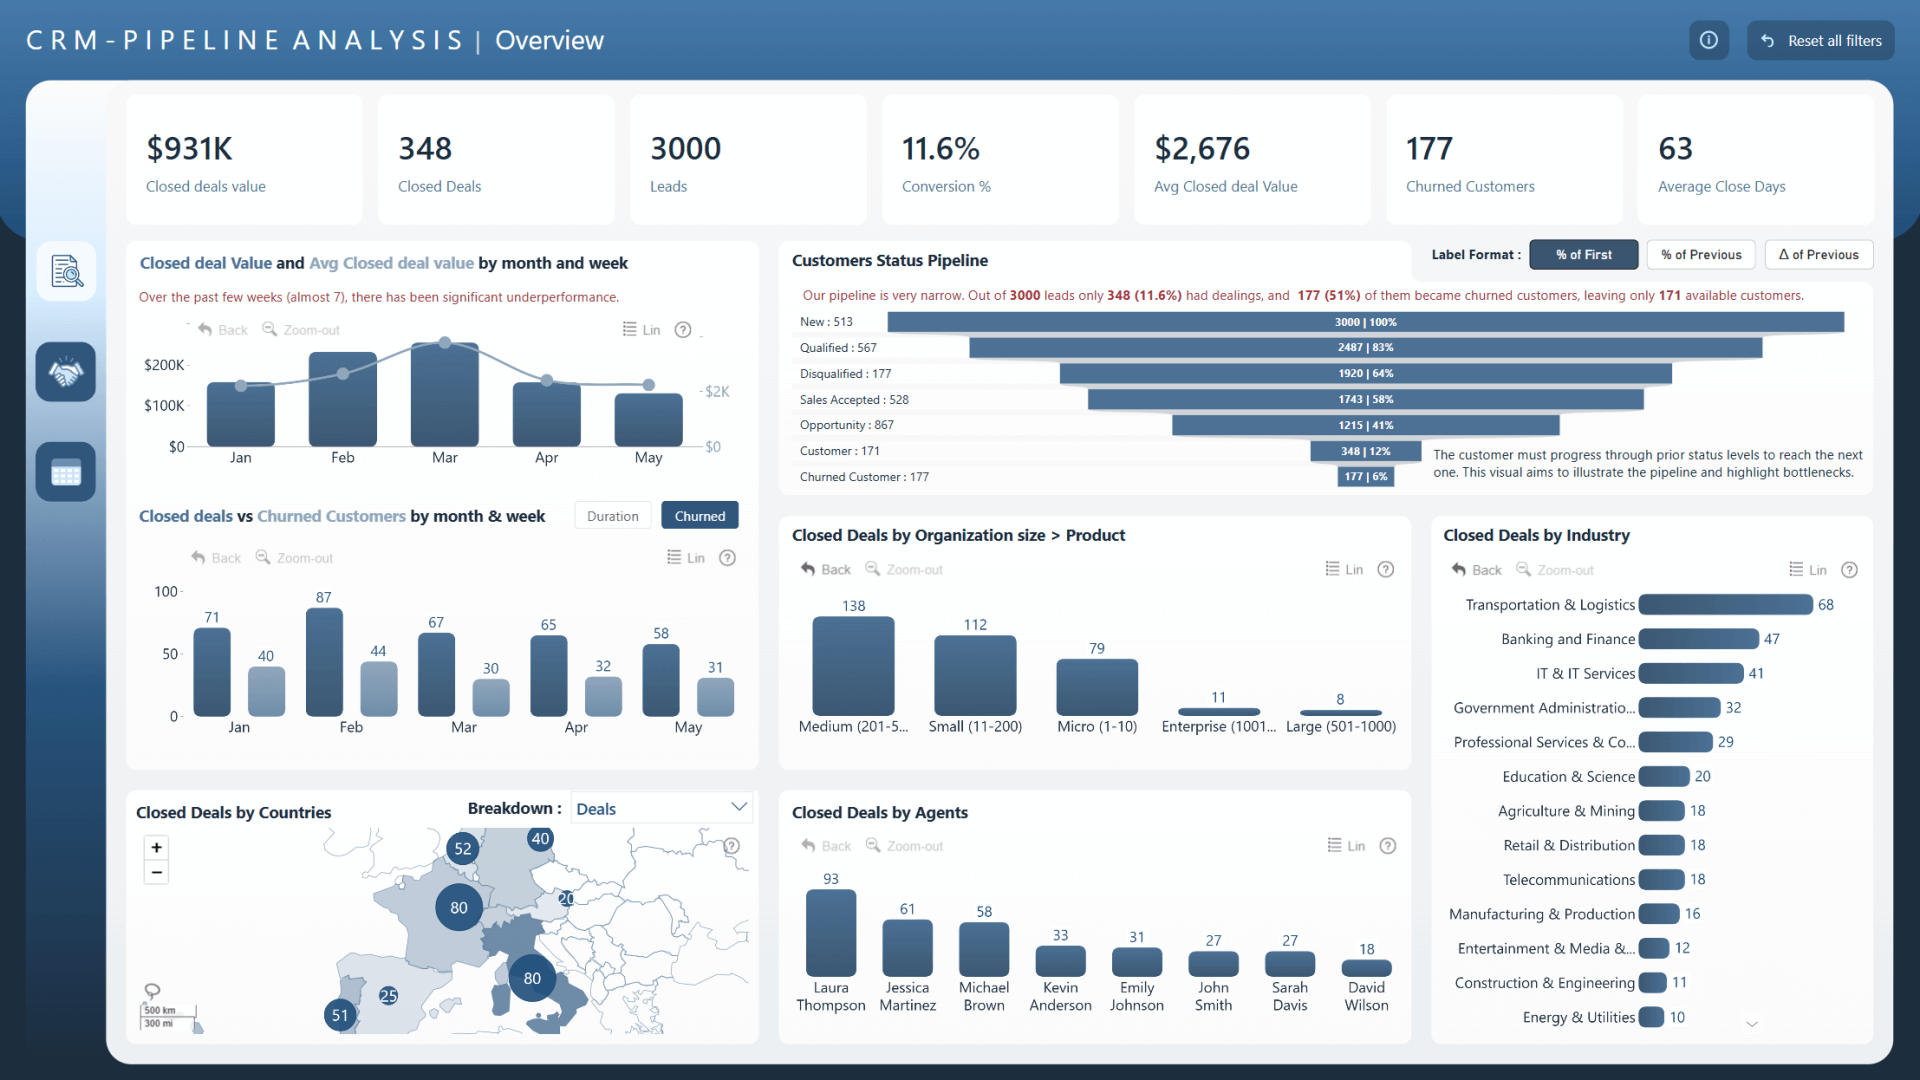
Summary Analyze your sales pipeline with this Power BI CRM dashboard example! The report will instantly reveal the most important […]
-
4 Power BI Financial Analysis Dashboard
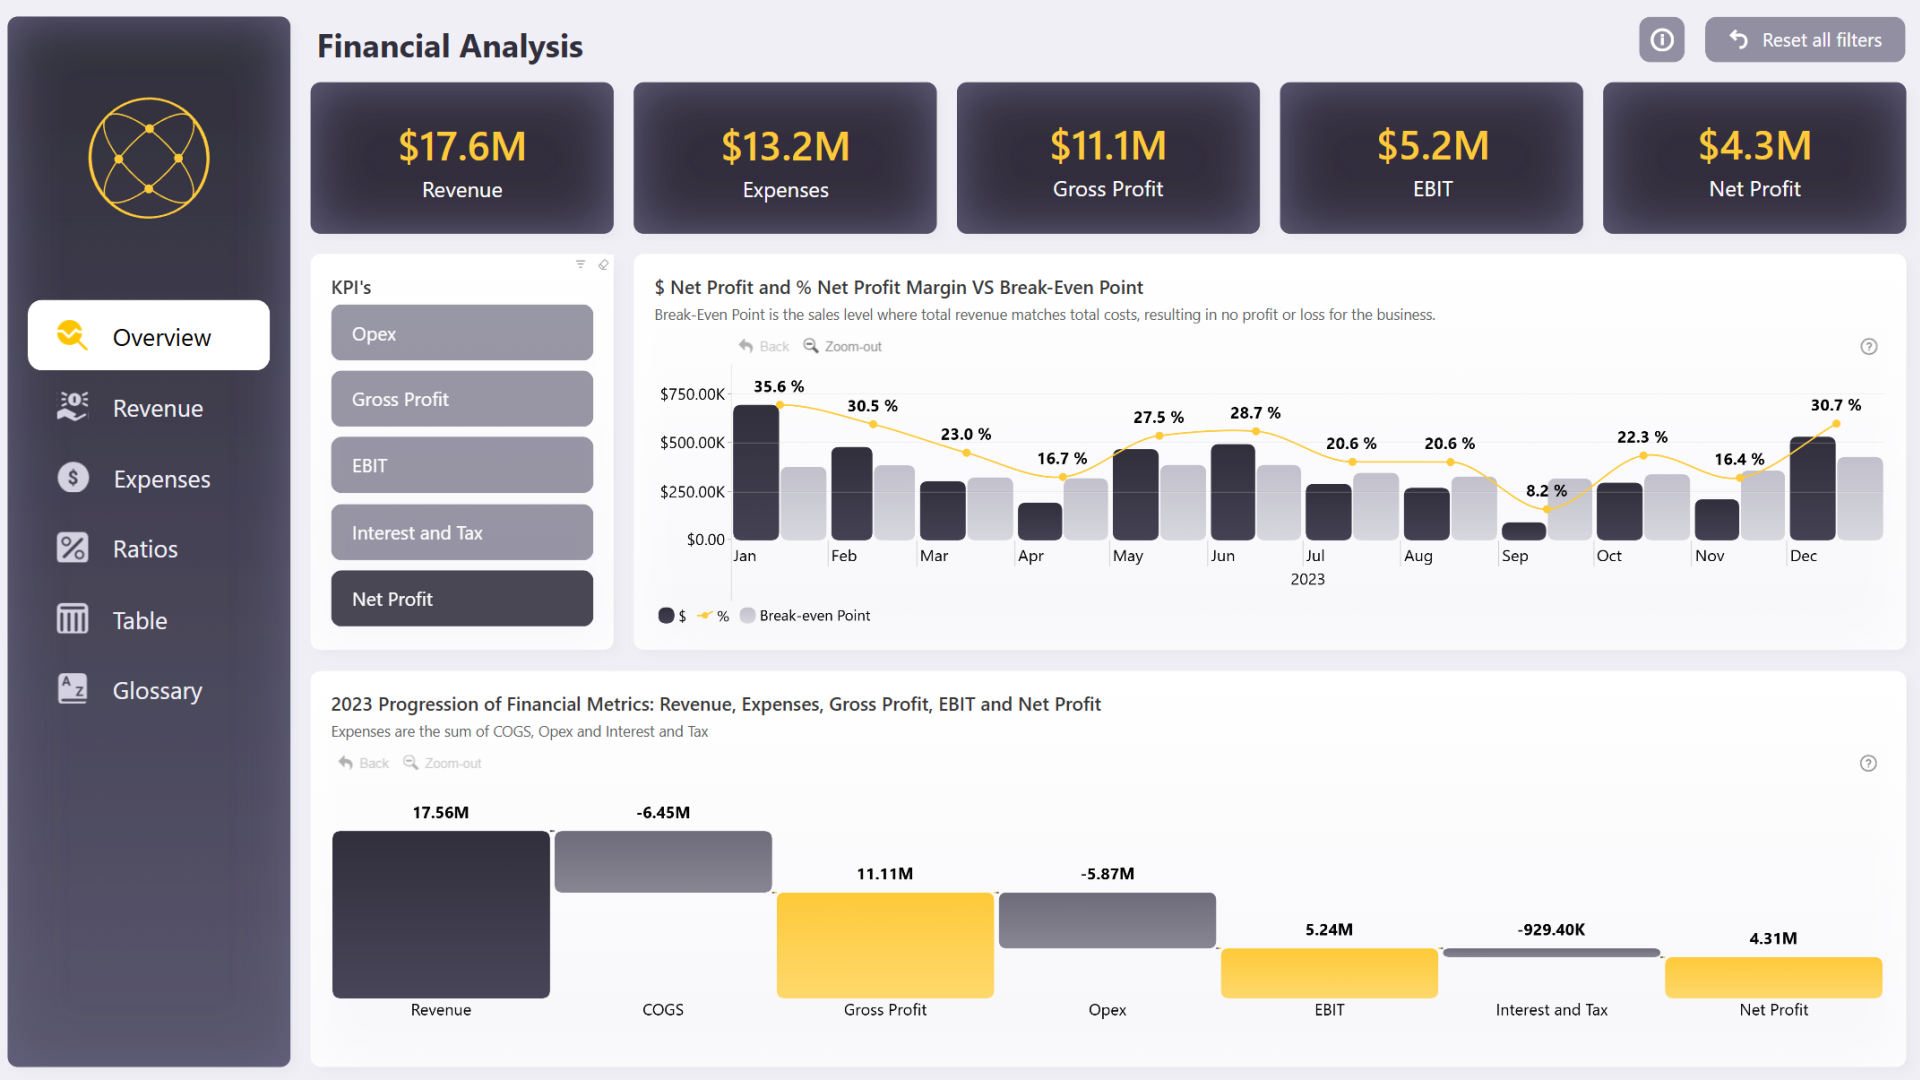
Key Insights of Power BI Financial Analysis Dashboard The report is structured in six pages. The initial view displays an […]
-
5 Power BI Market Research Report: Mobile Game Analysis
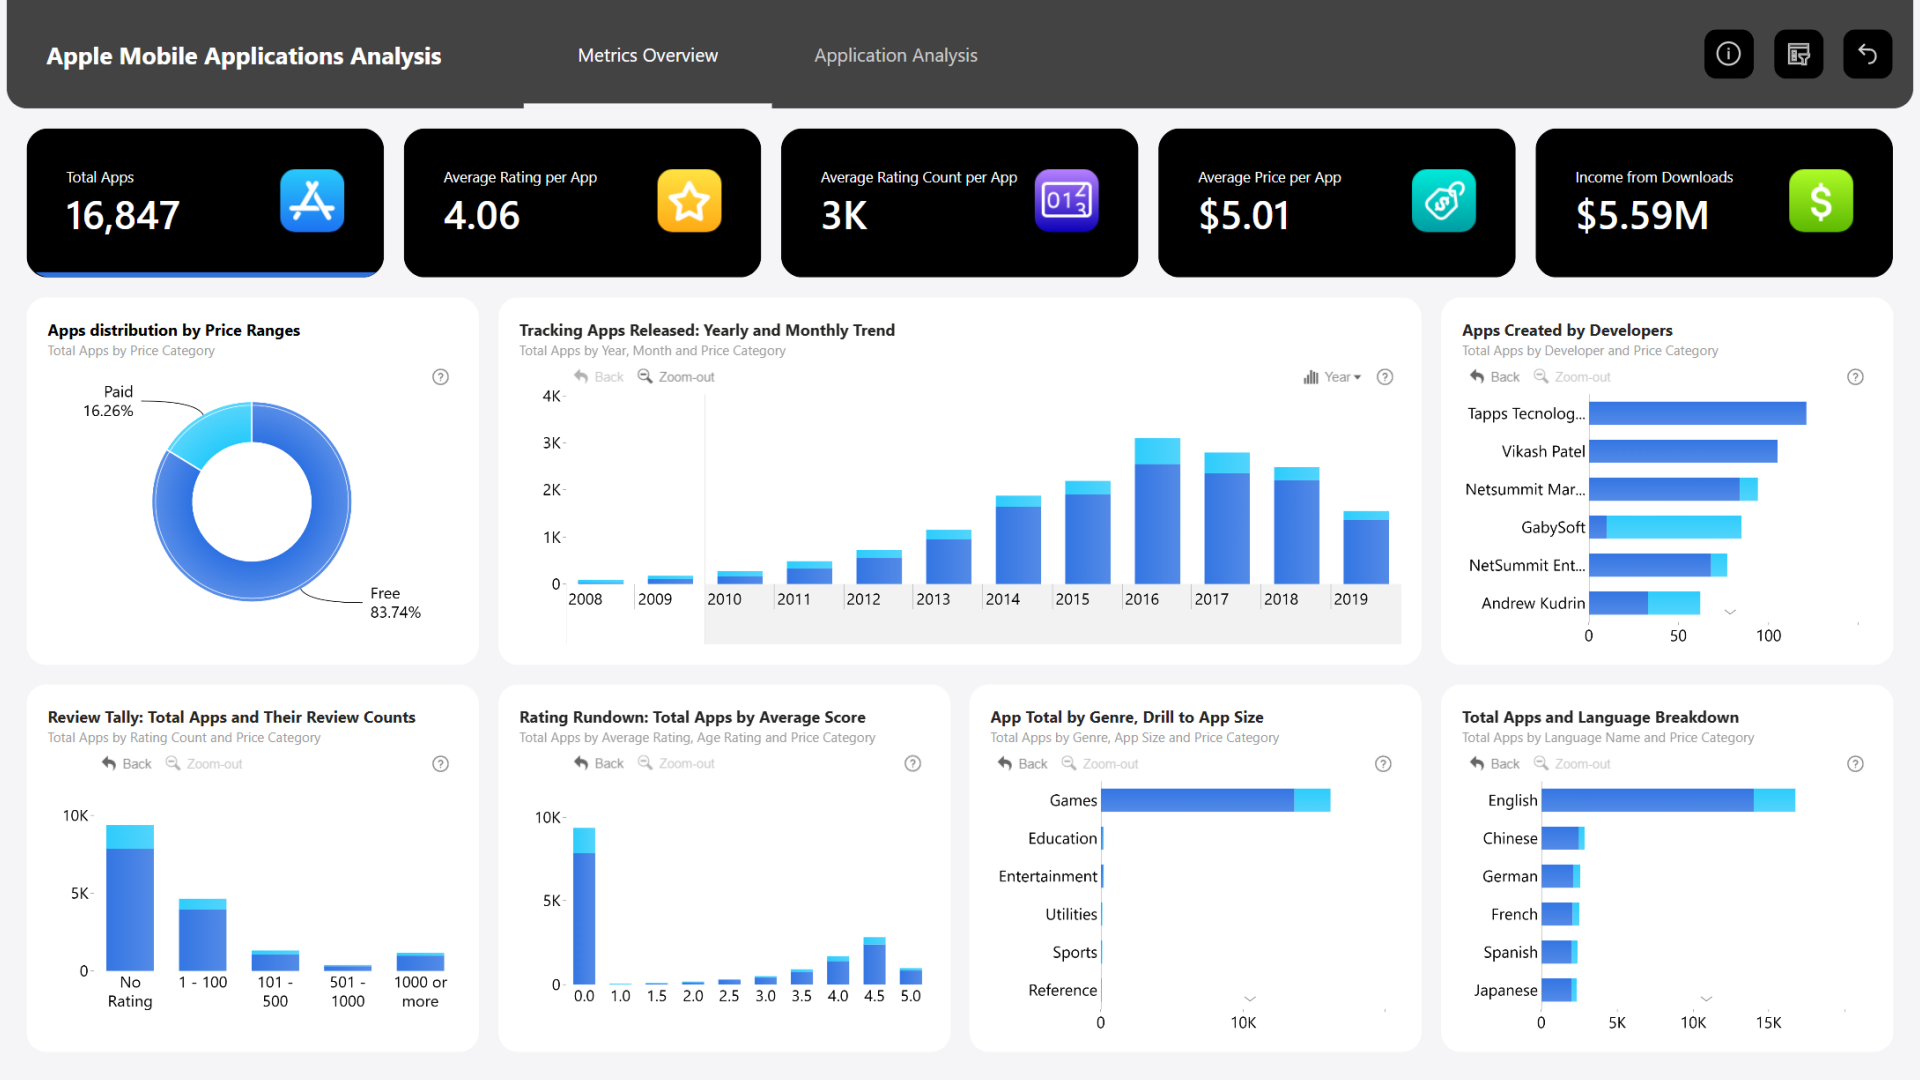
Summary Market research is an important step that allows you to identify your main competitors, find your target audiences and […]
-
6 Power BI Email Communication Analysis Report
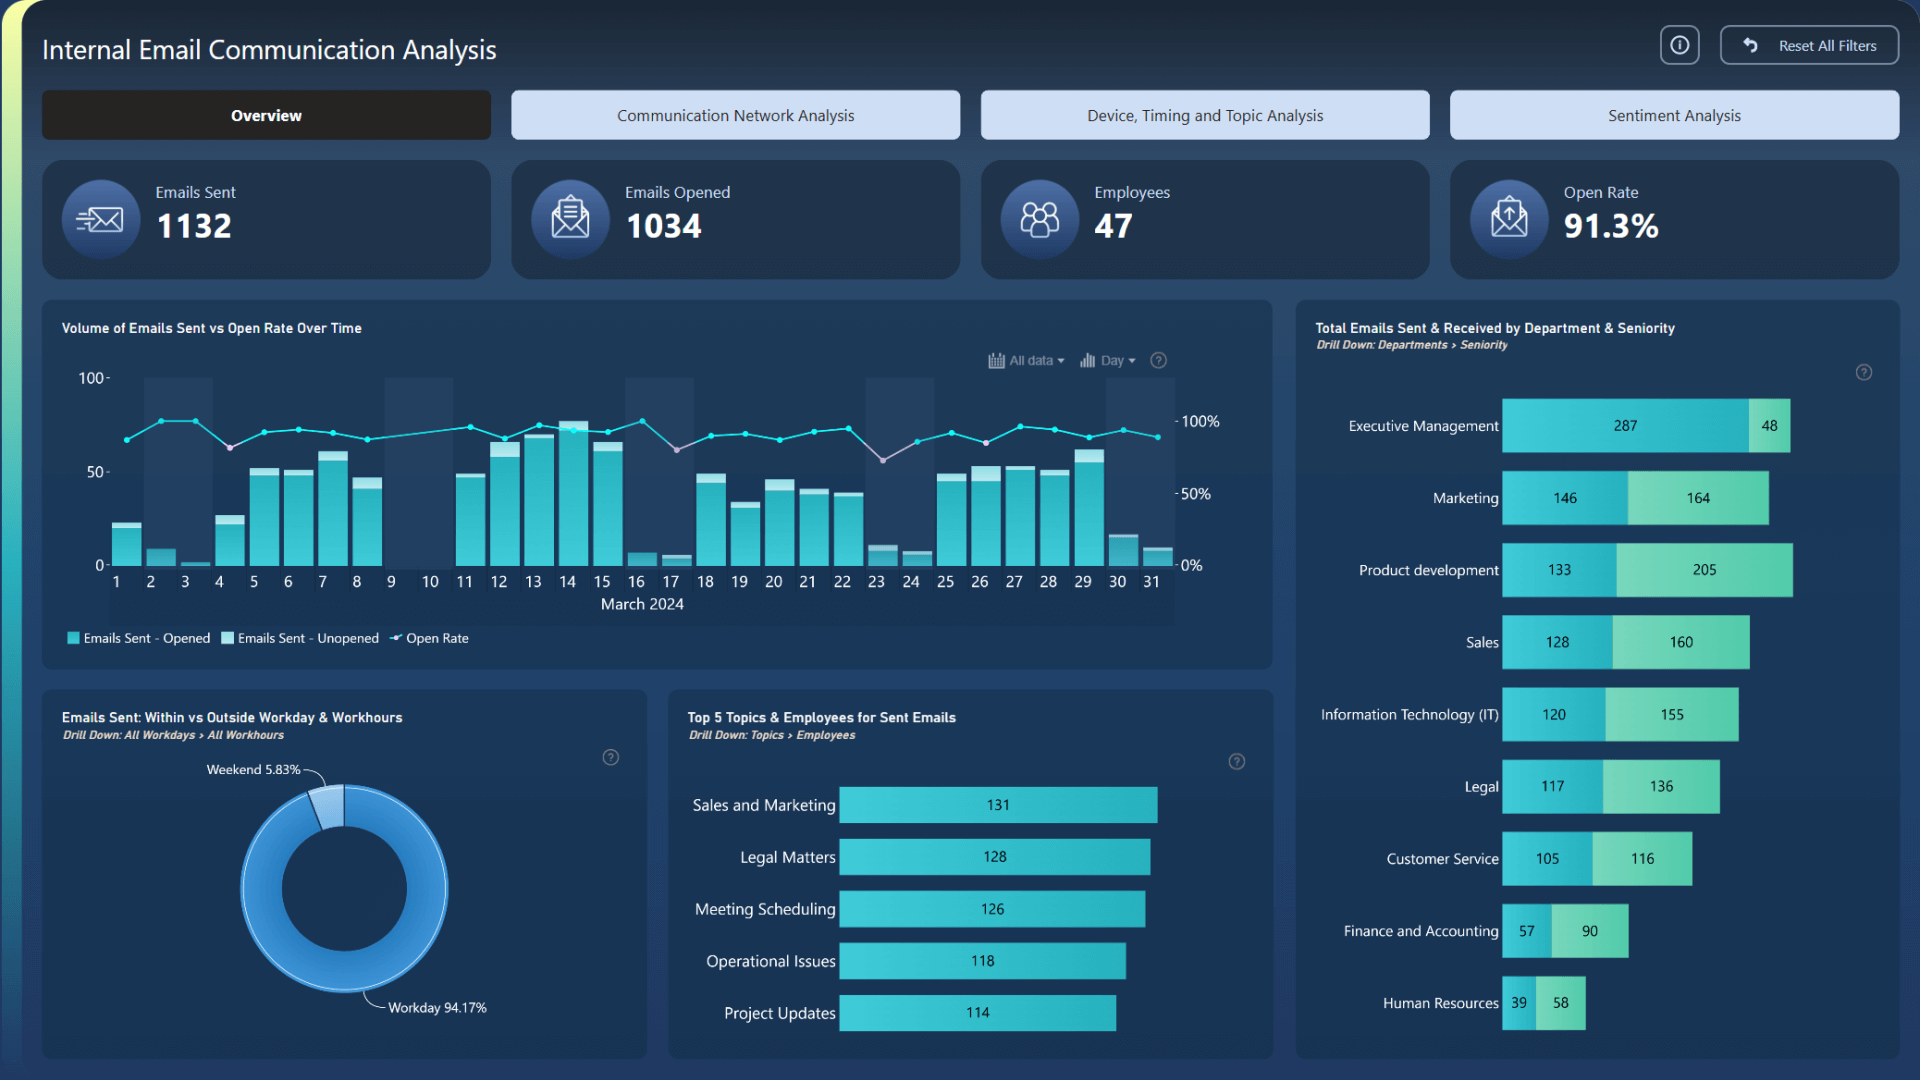
Summary This Power BI email communication analysis report will help you uncover valuable insights about internal comms and keep your […]
-
7 Marketing Campaign Analysis Power BI Report
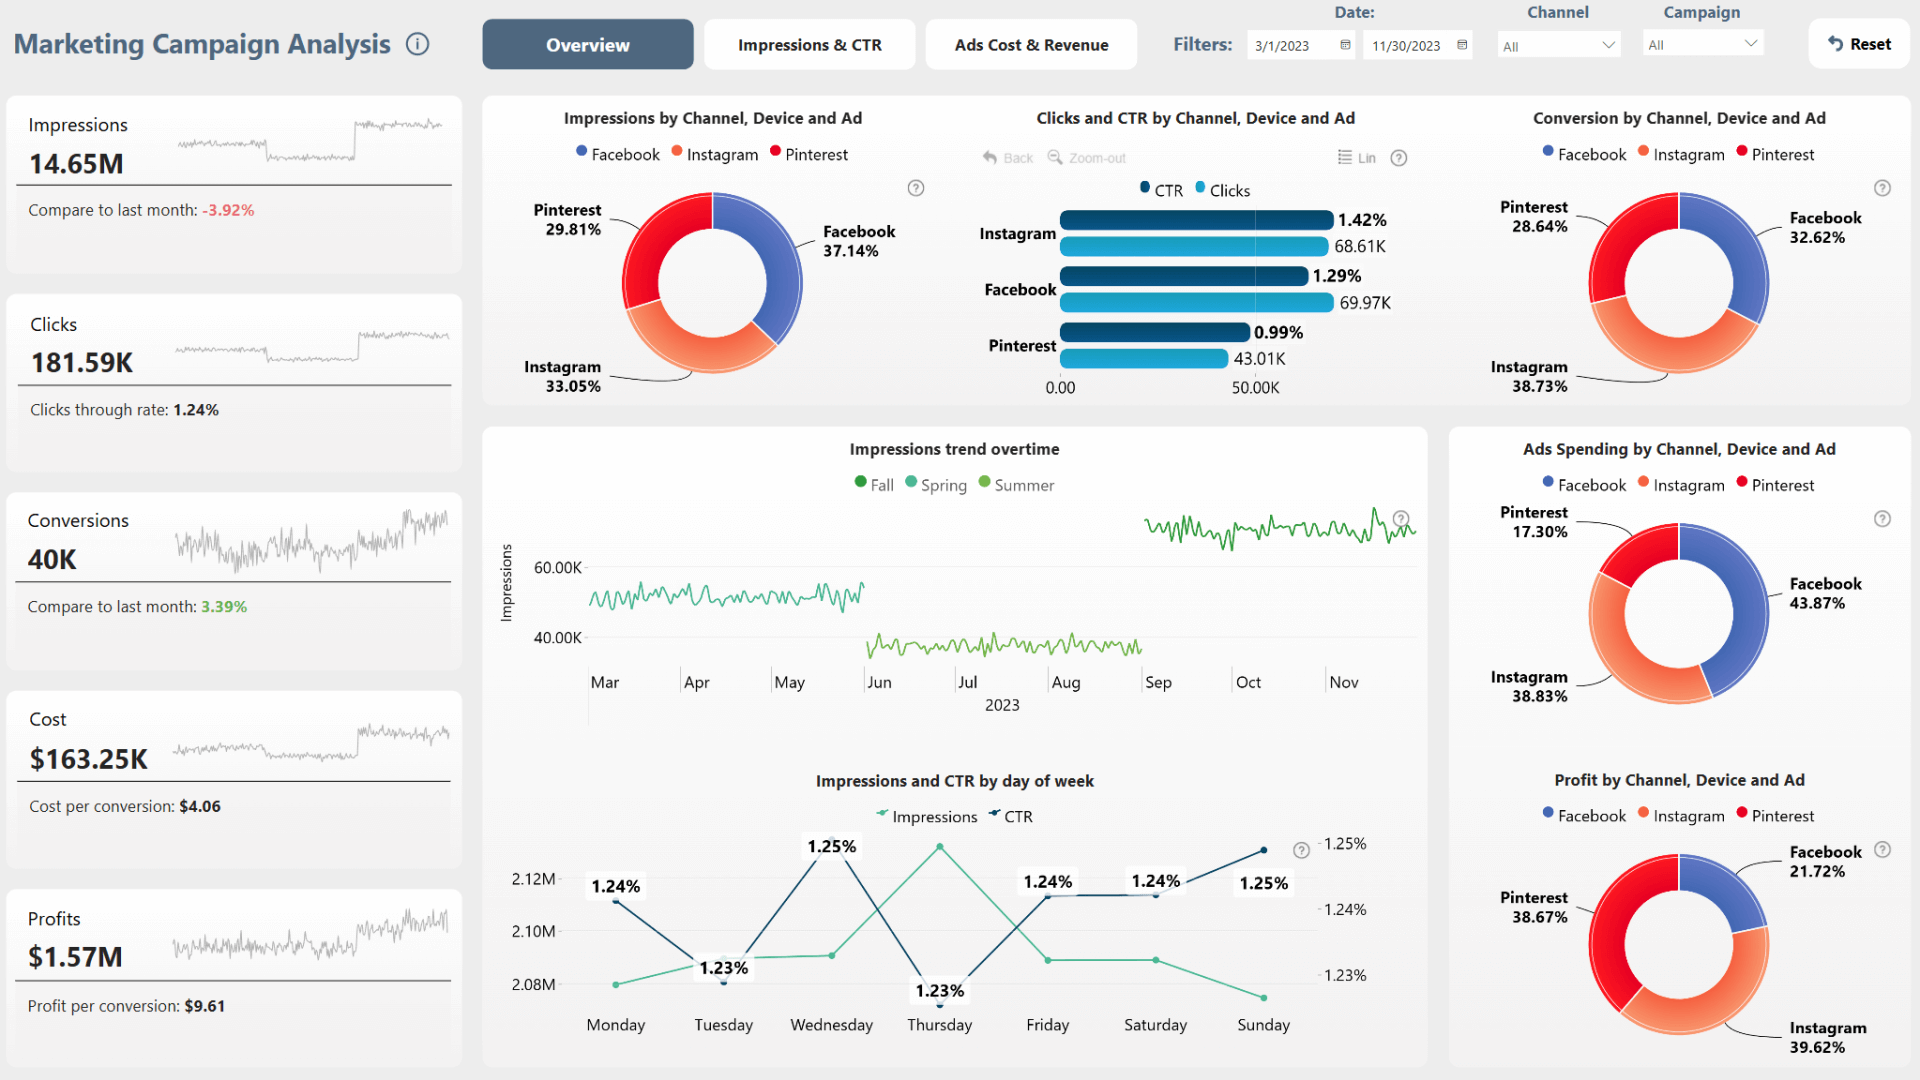
Key Insights of This Report This report displays various metrics from two targeted marketing campaigns in three cities (London, Manchester, […]
-
8 Power BI Service Desk Dashboard
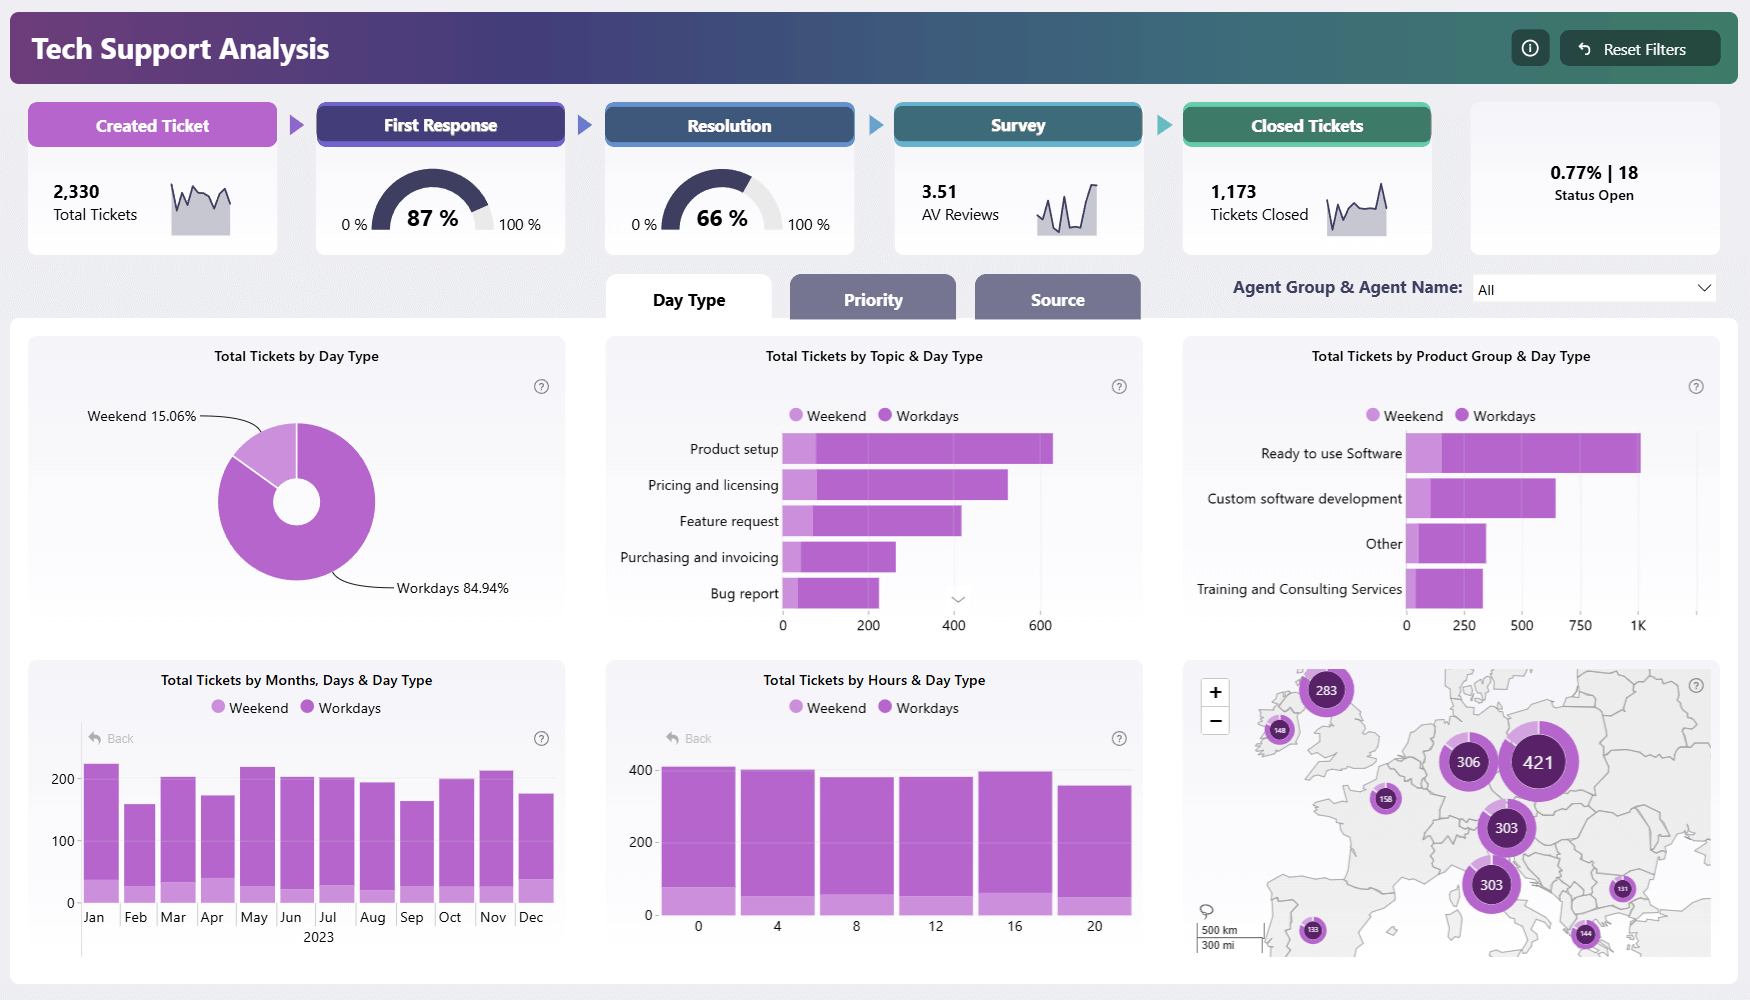
Key Metrics of This Report This Power BI service dashboard provides insights about various performance metrics, including: You can filter […]
-
9 HR Analytics Dashboard
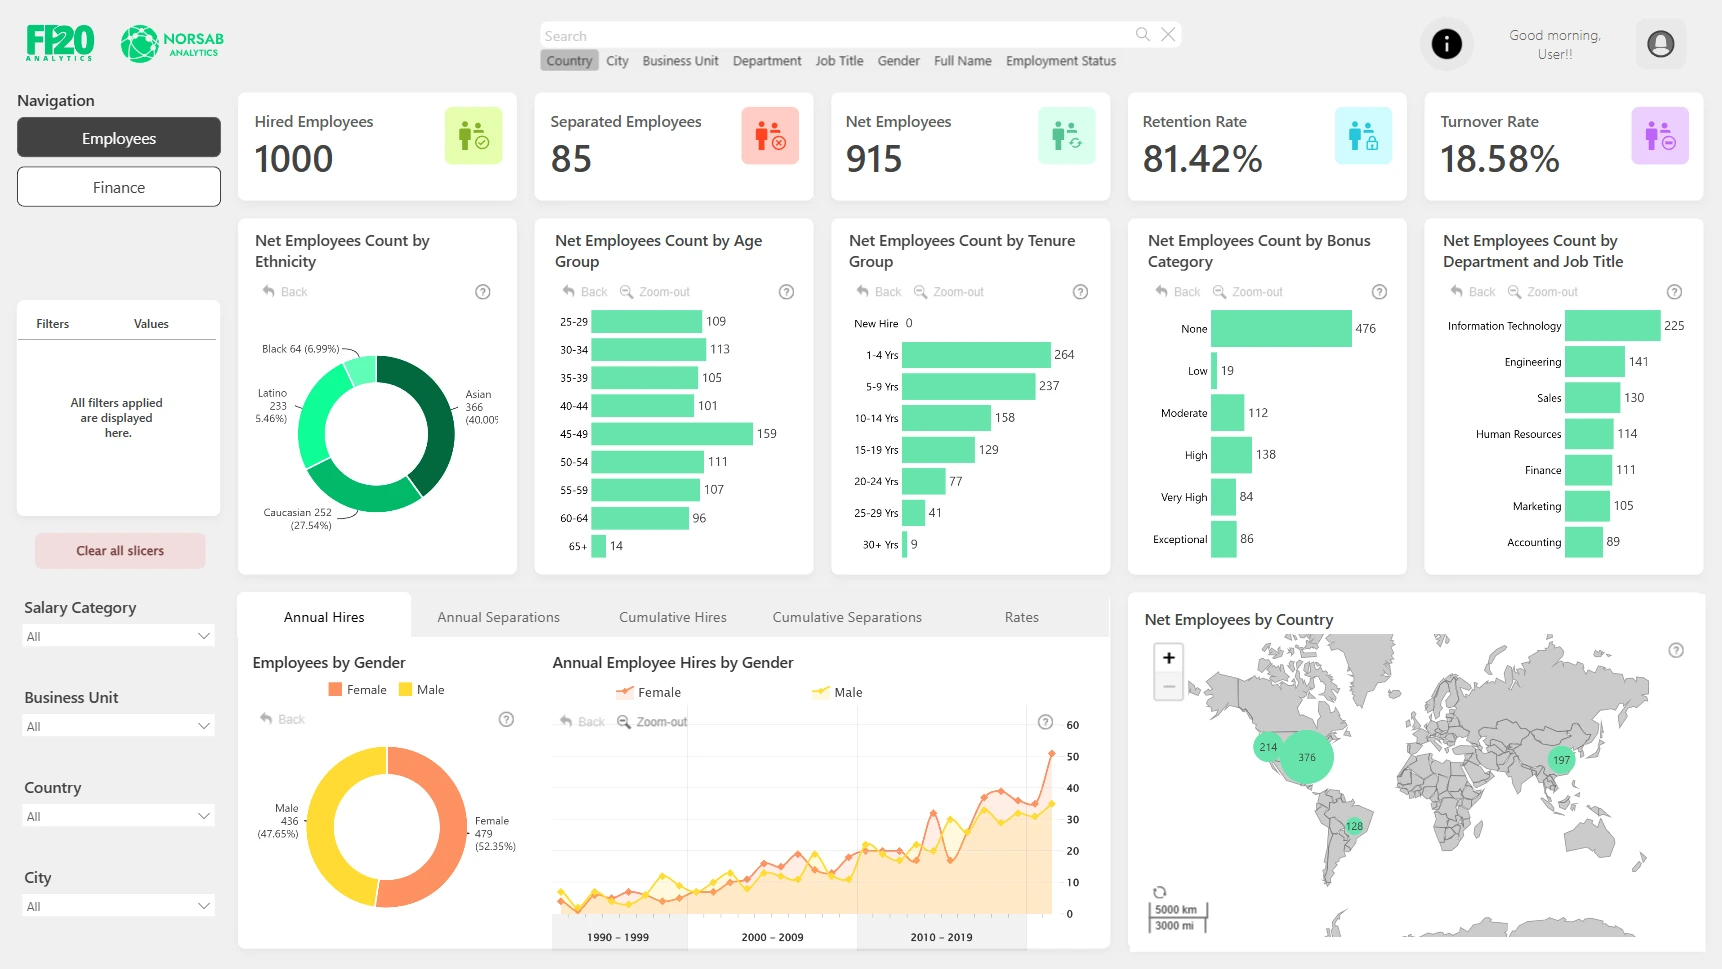
Key Features and Insights How to Use the HR Analytics Dashboard Interact directly with any chart element for a deeper […]
-
10 Customer Review Analysis Power BI Report
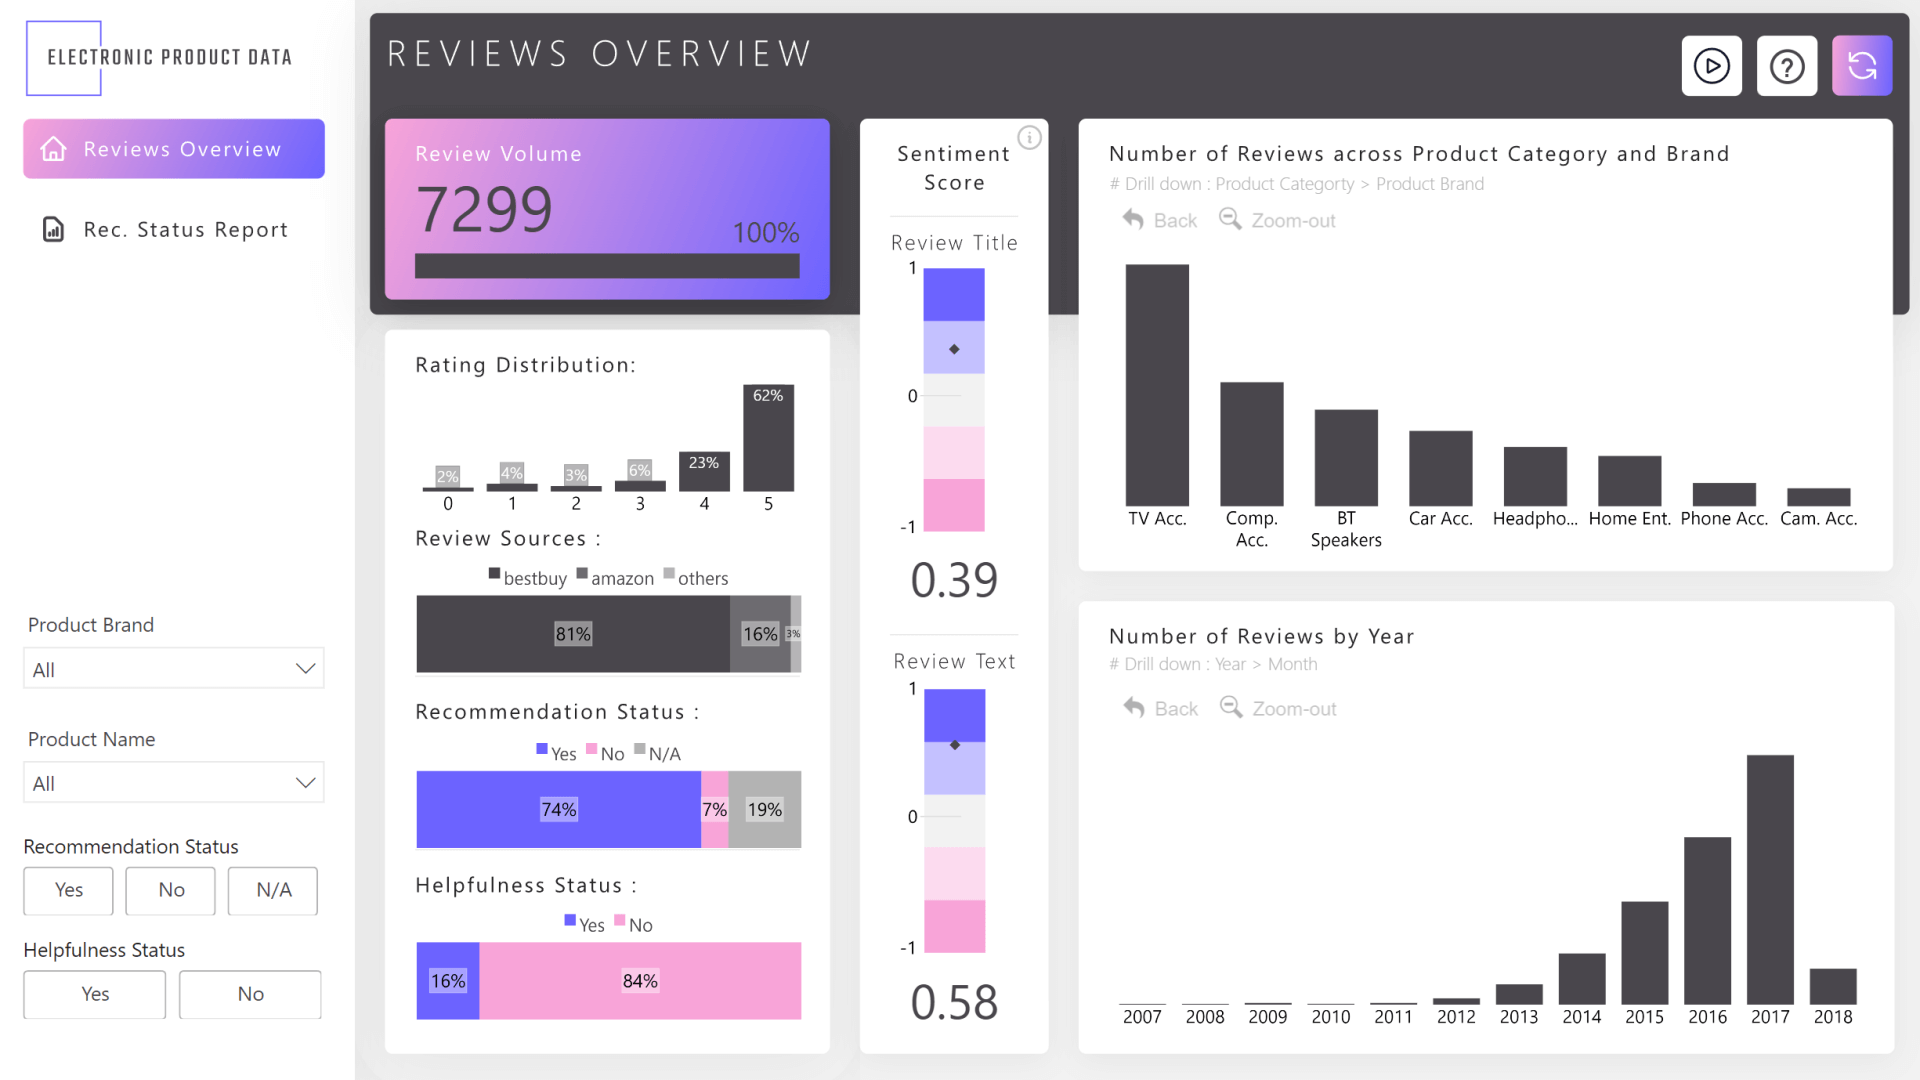
How To Use This Report Template To interact with this Power BI report, simply click any active elements directly on […]
-
11 Used Car Sales Analytics Power BI Report
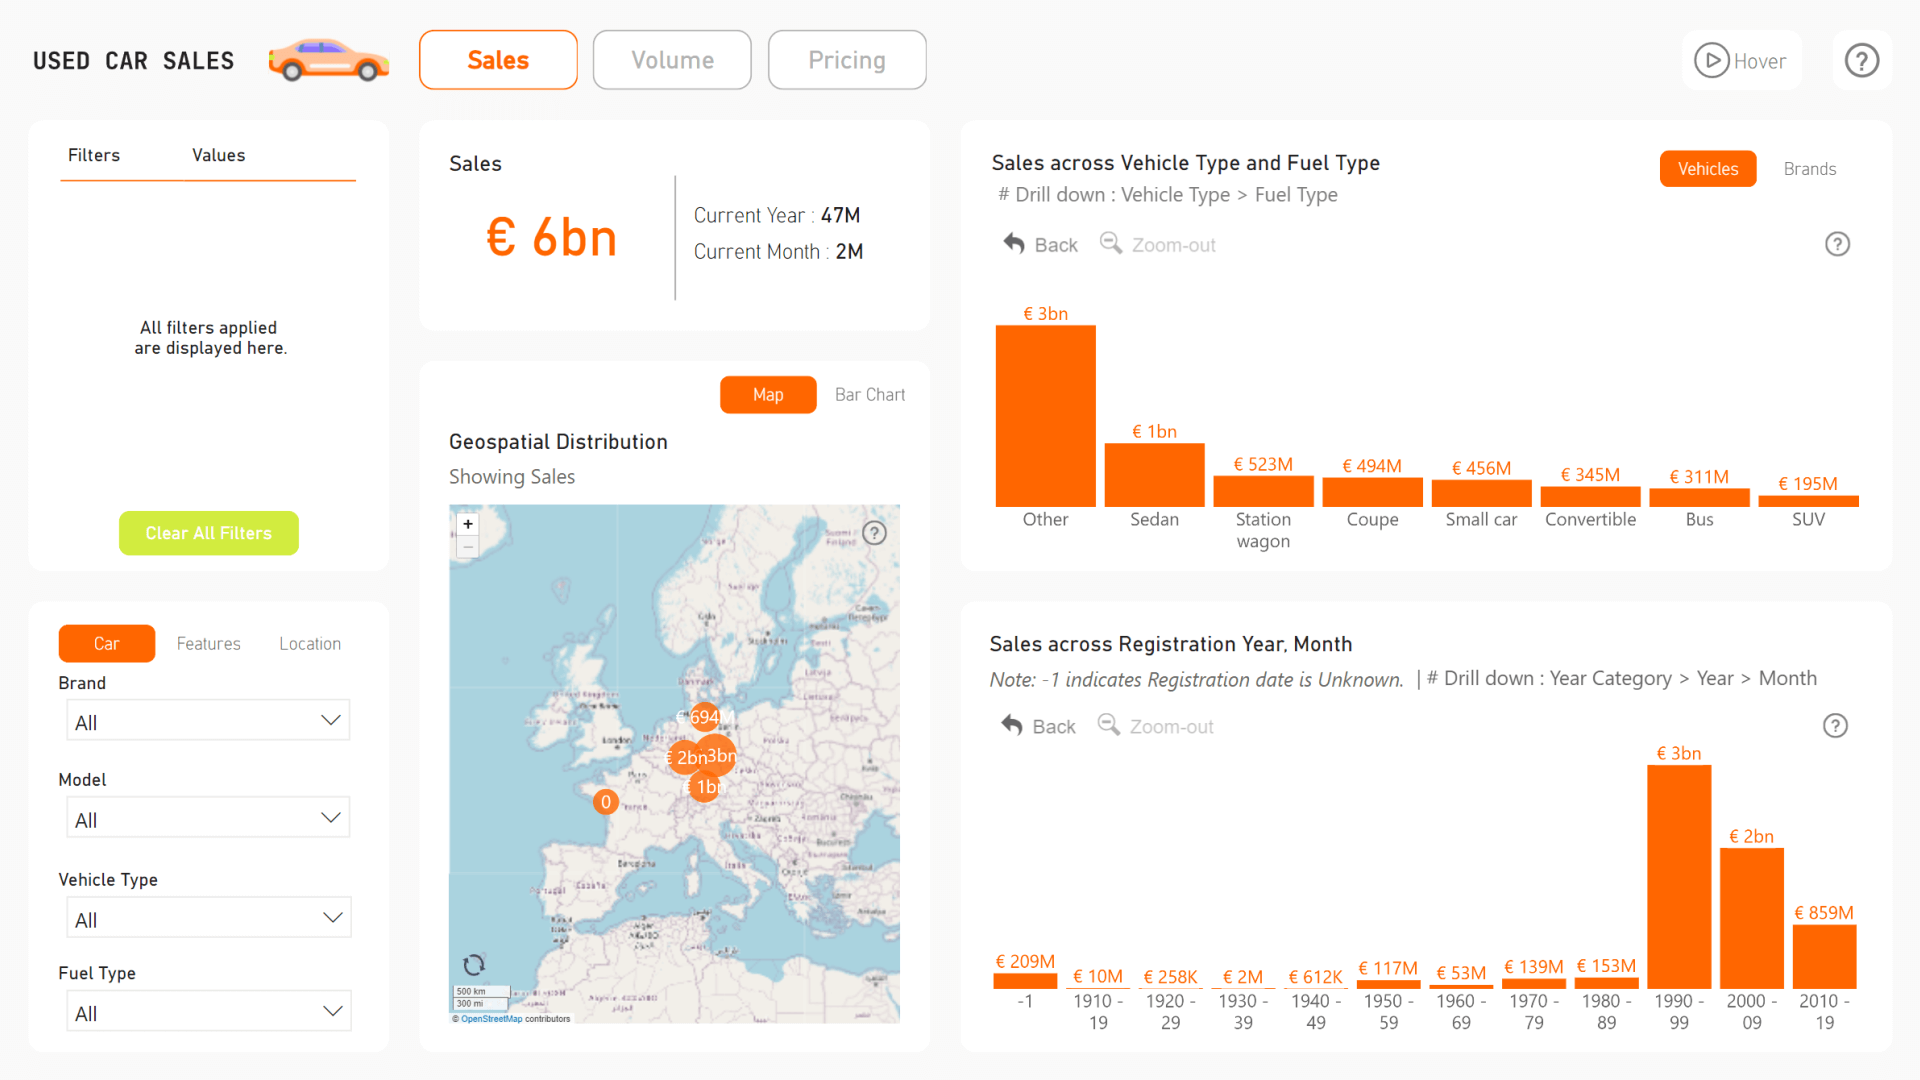
The report uses multiple interactive visuals to provide various insights about used car sales, including revenue or sales volume per […]
-
12 Movie Industry Insights Power BI Report
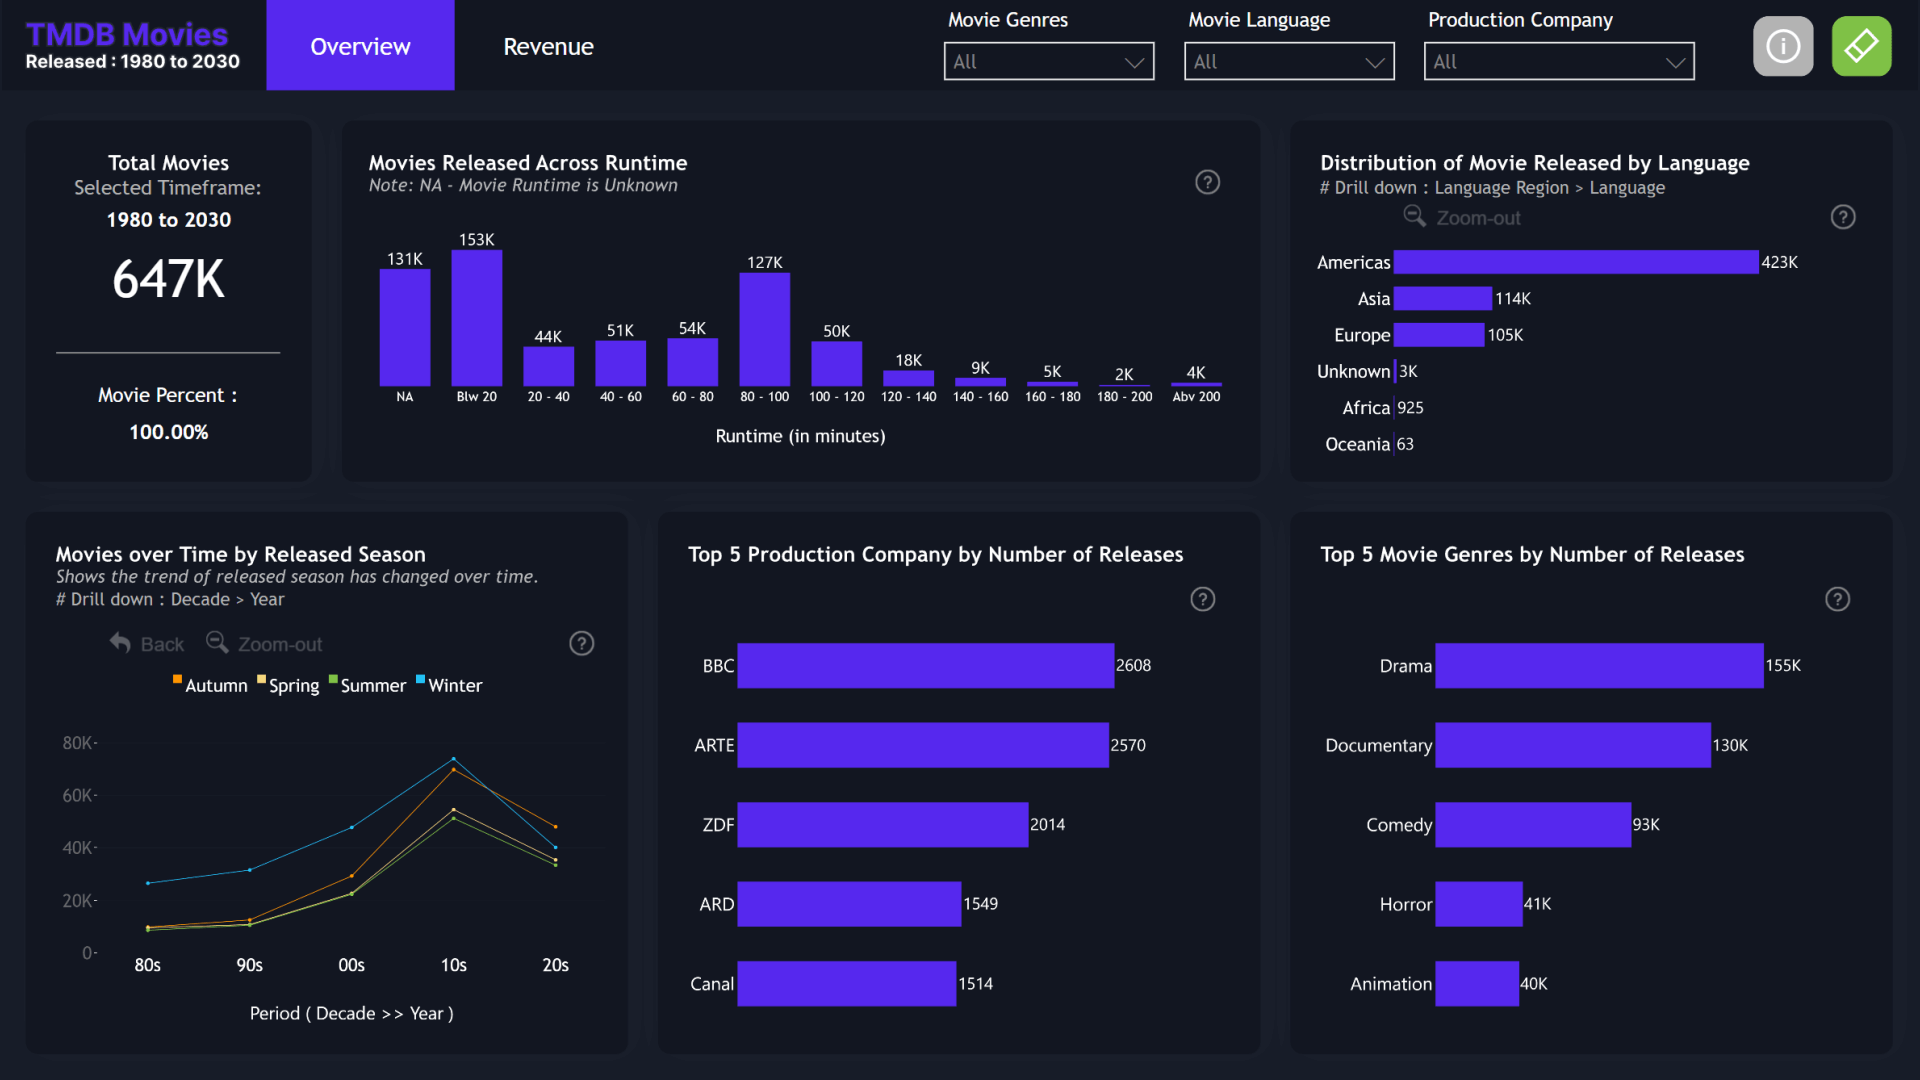
With multiple interactive visuals, users can explore the the number of movie releases per genre, release season, movie runtime, and […]
-
13 Fuel Price Analysis Power BI Report
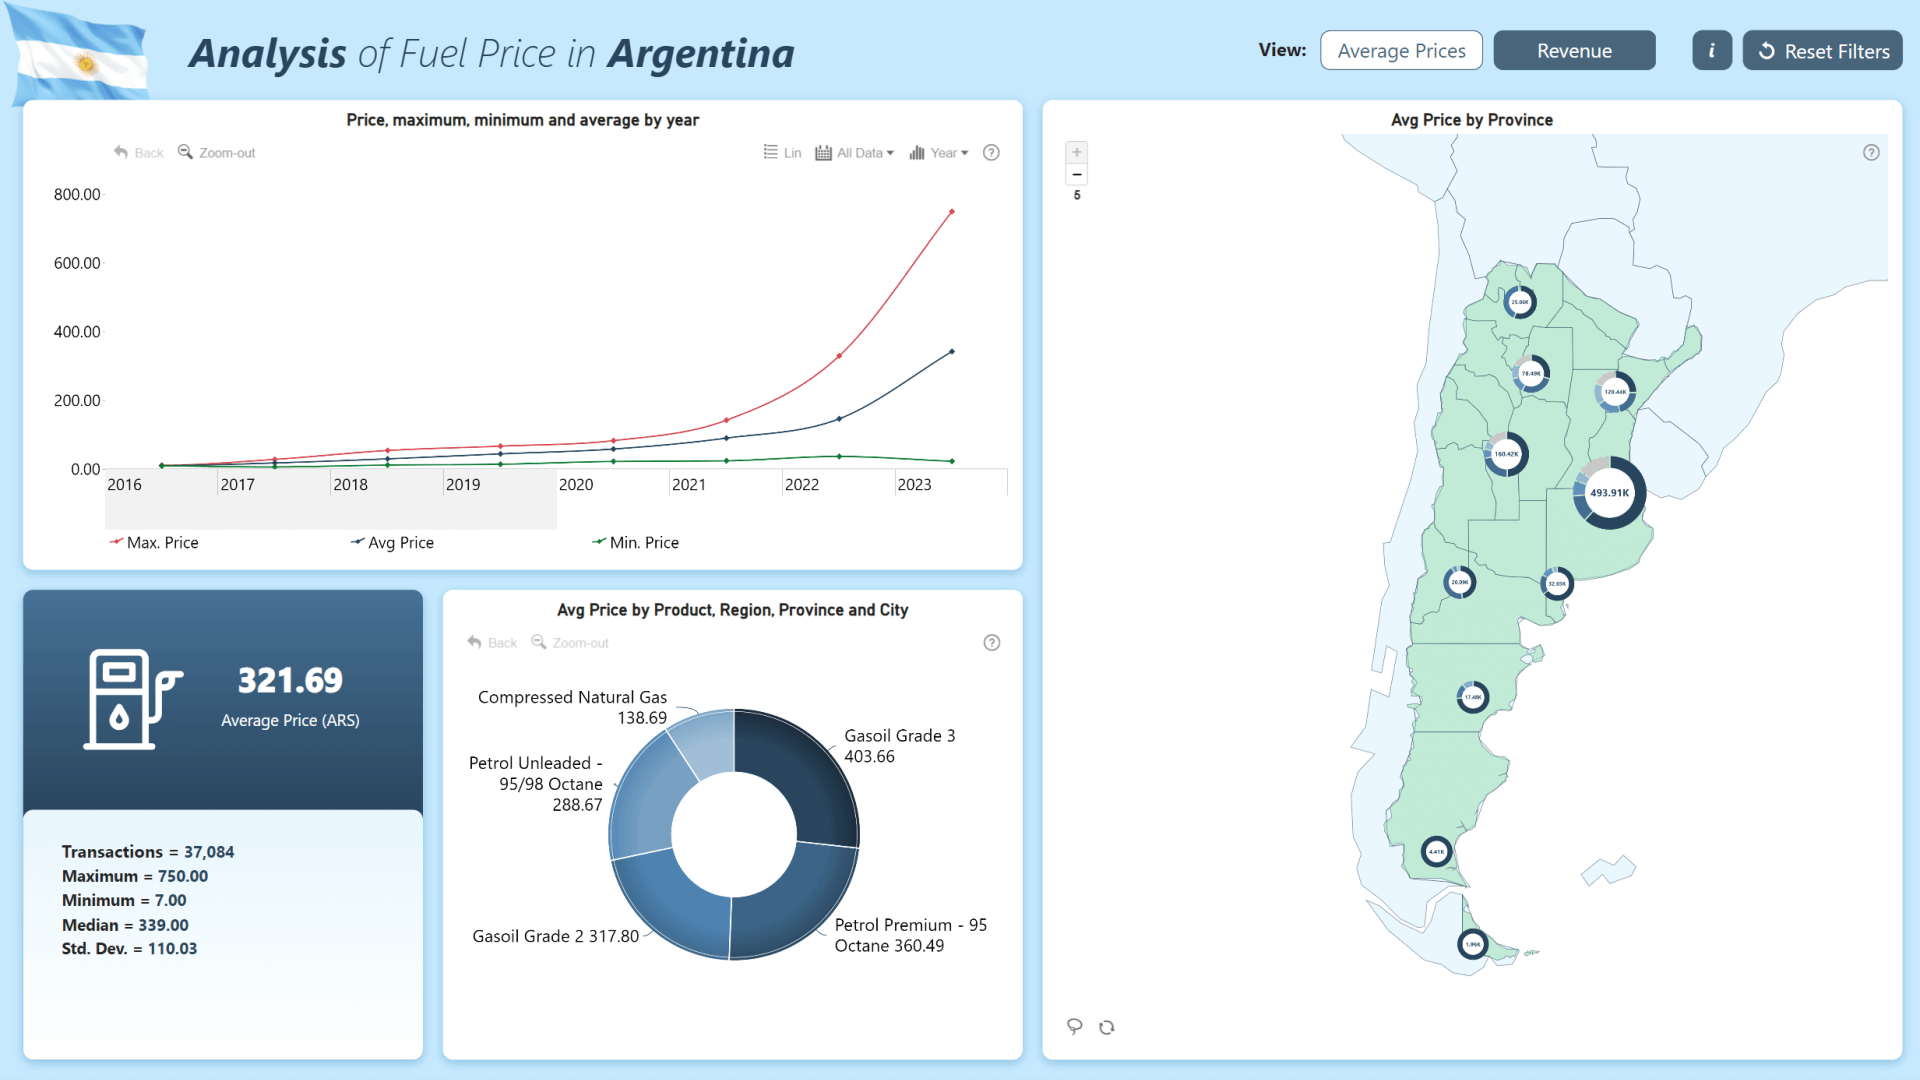
The report consists of two pages – one for the average fuel price comparison, and the other for revenue analysis. […]
-
14 HR Analytics Power BI Report
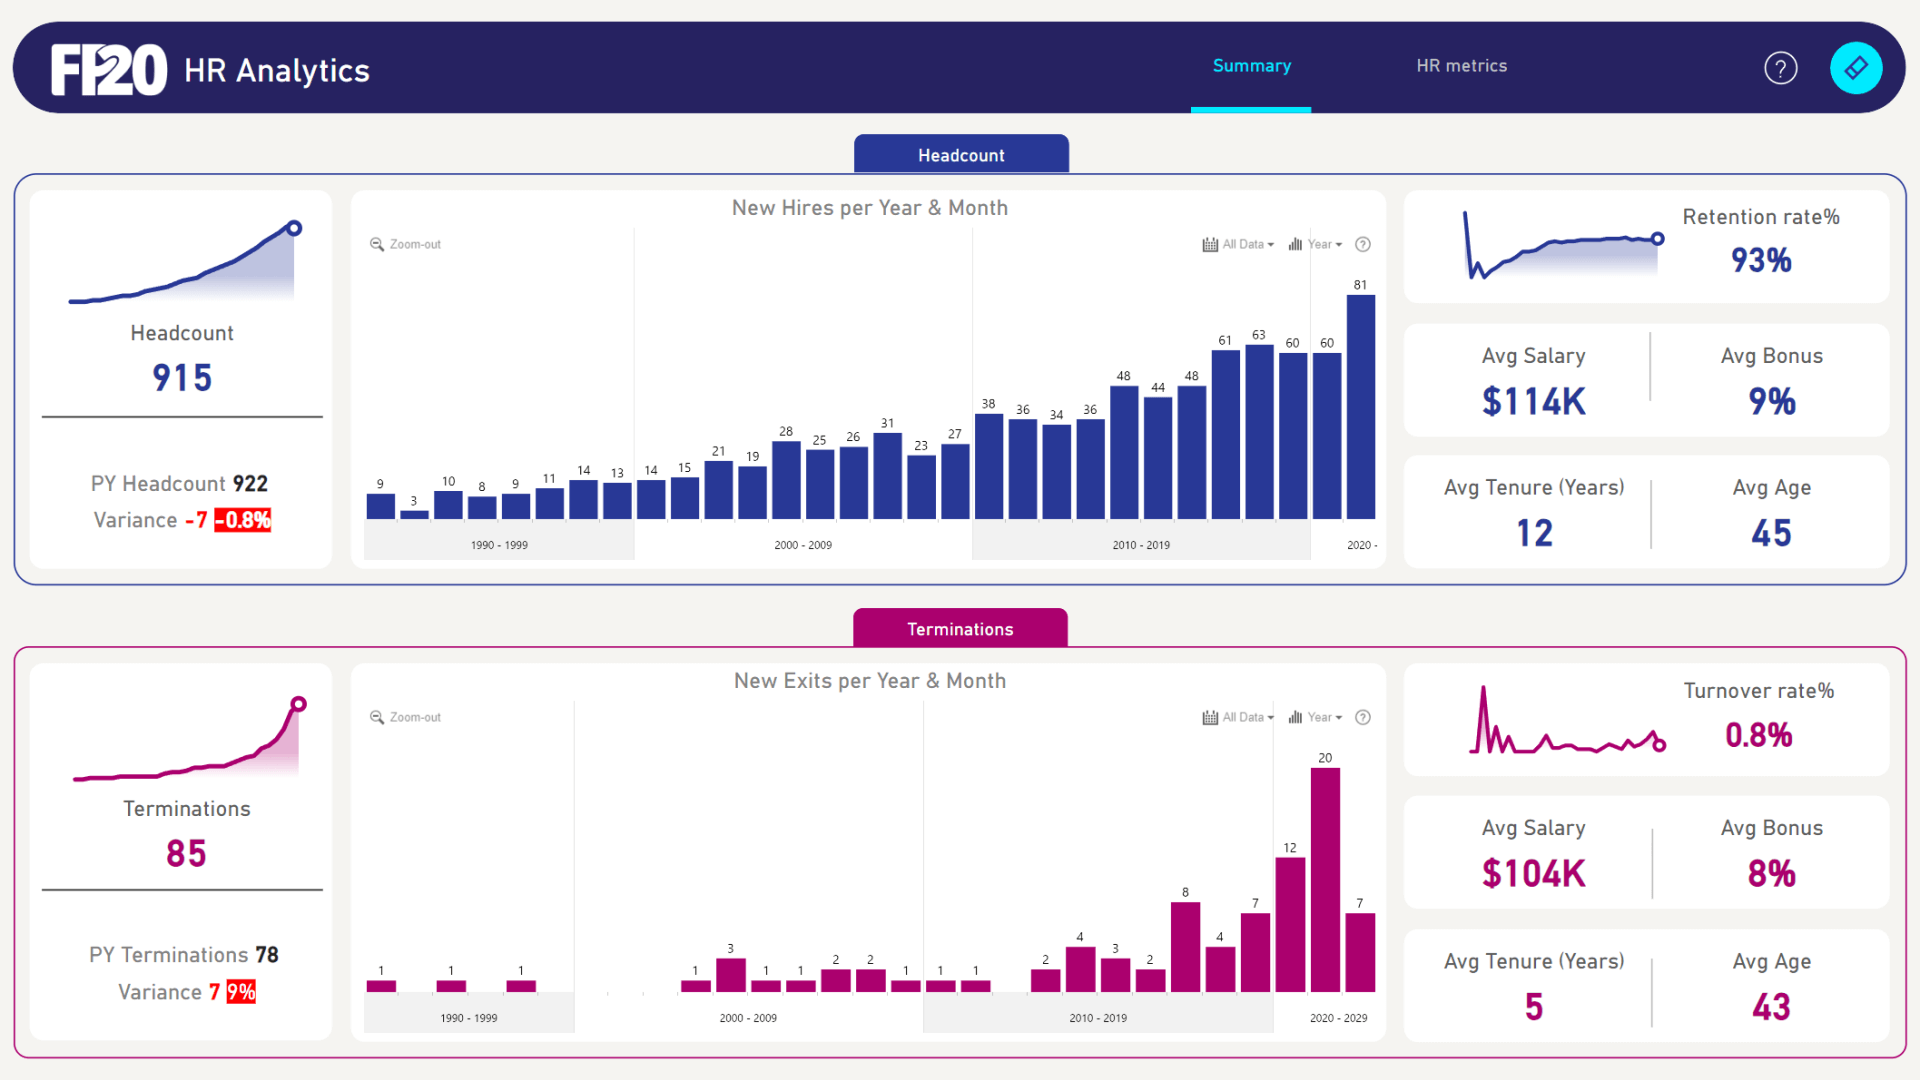
How To Use This Report Template To interact with this Power BI report, simply click any active elements directly on […]
-
15 Udemy Courses Analysis Power BI Report
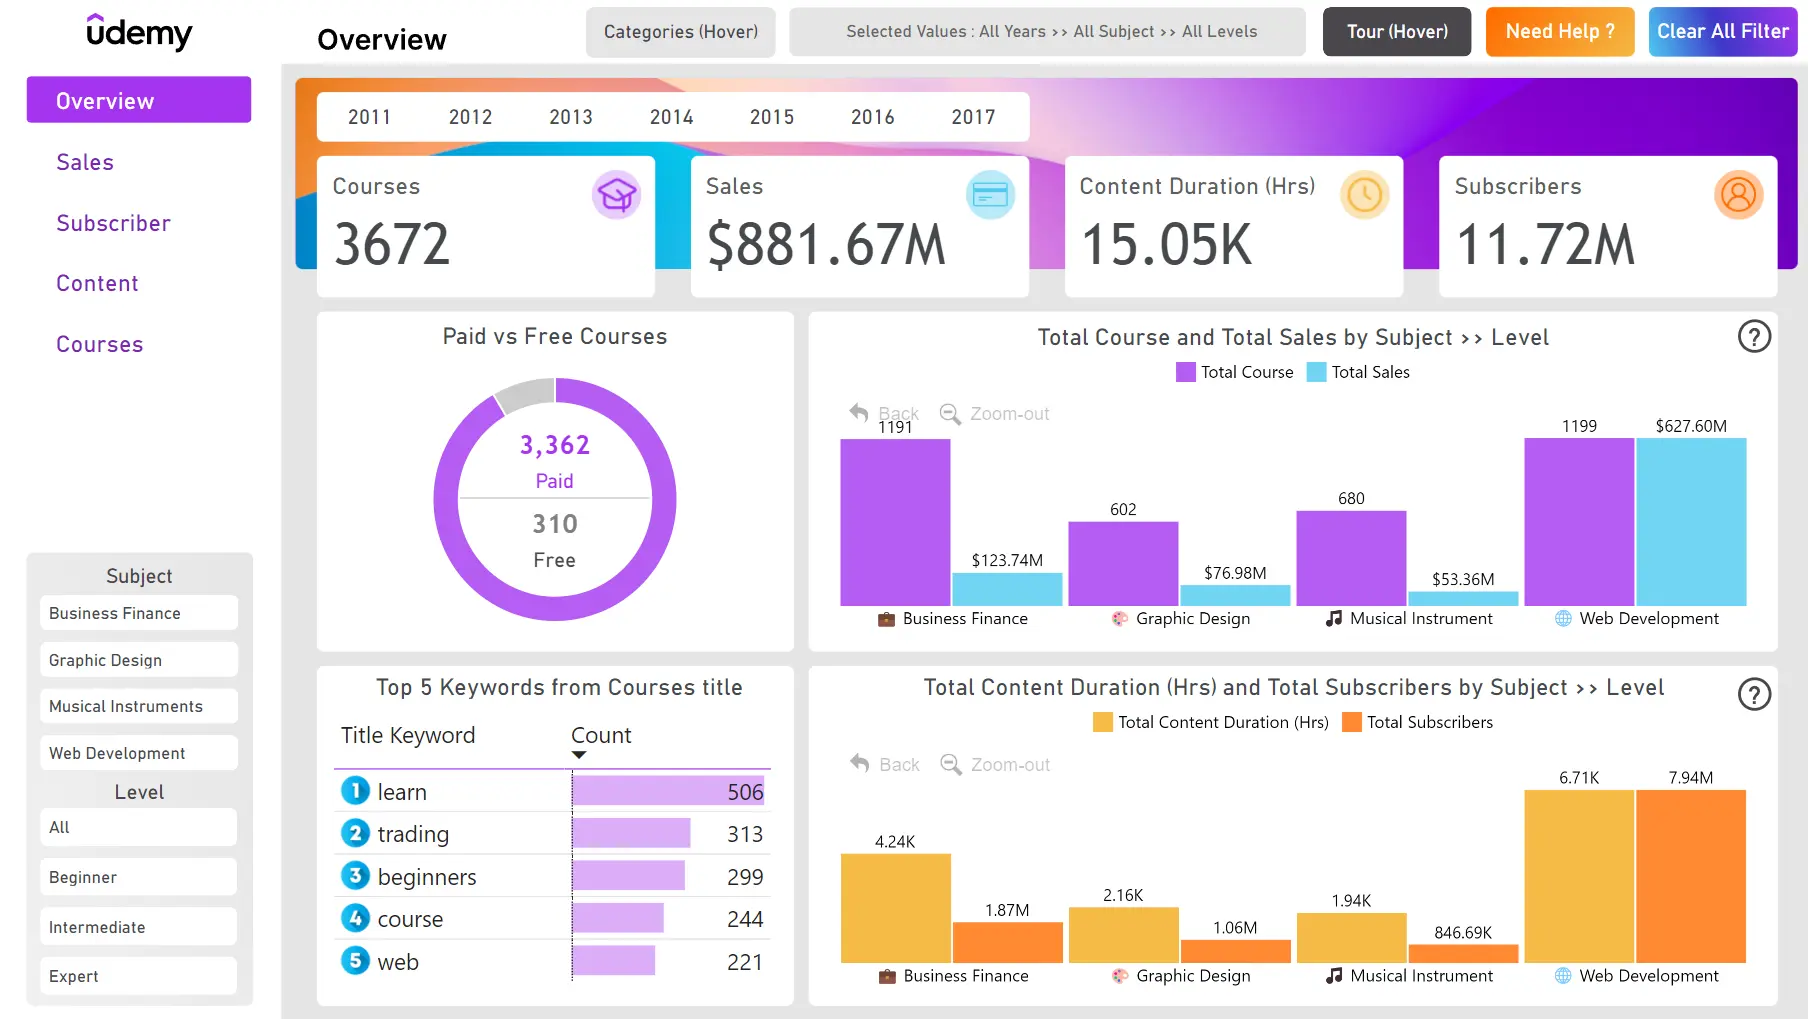
If you are looking for inspiration on customer retention analysis in Power BI, this report is a great example. The […]
-
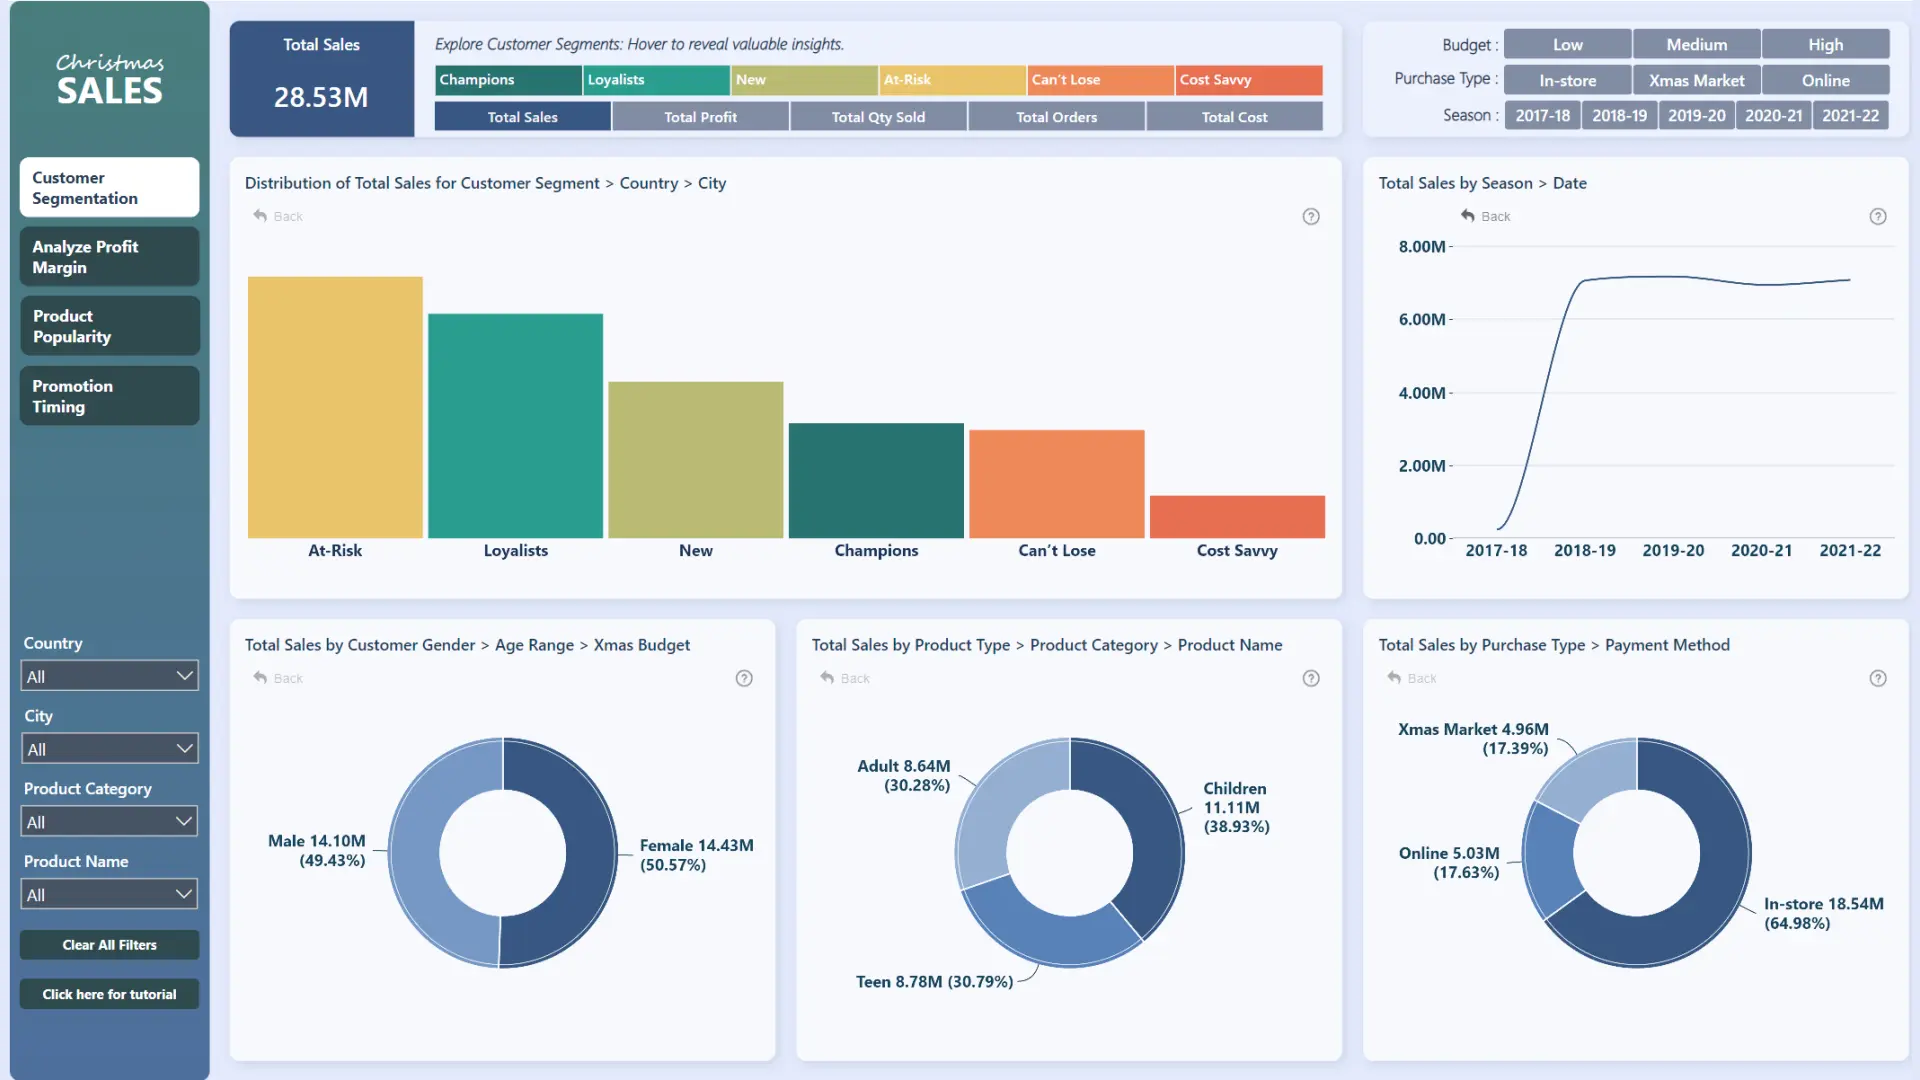
16 Christmas Gift Trends Power BI Retail Sales Dashboard
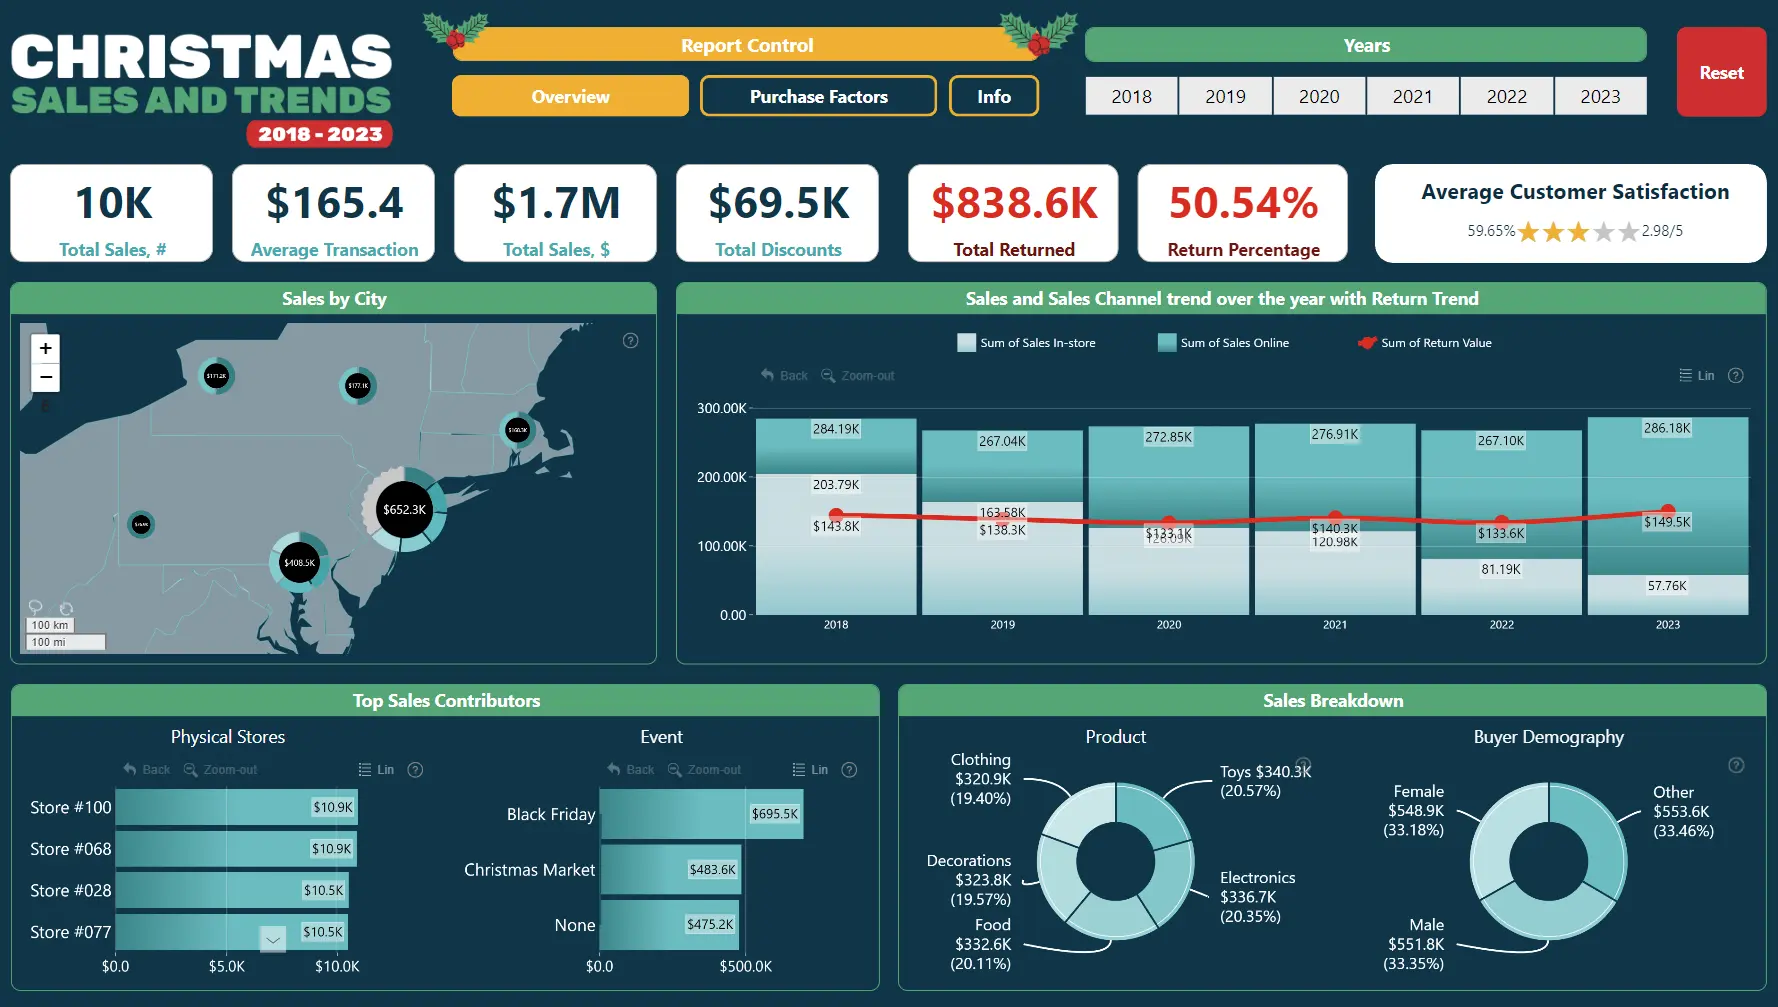
Across multiple visuals that dynamically cross-filter each other, this report allows the user to analyze the same data from multiple […]
-
17 School Analytics Power BI Report
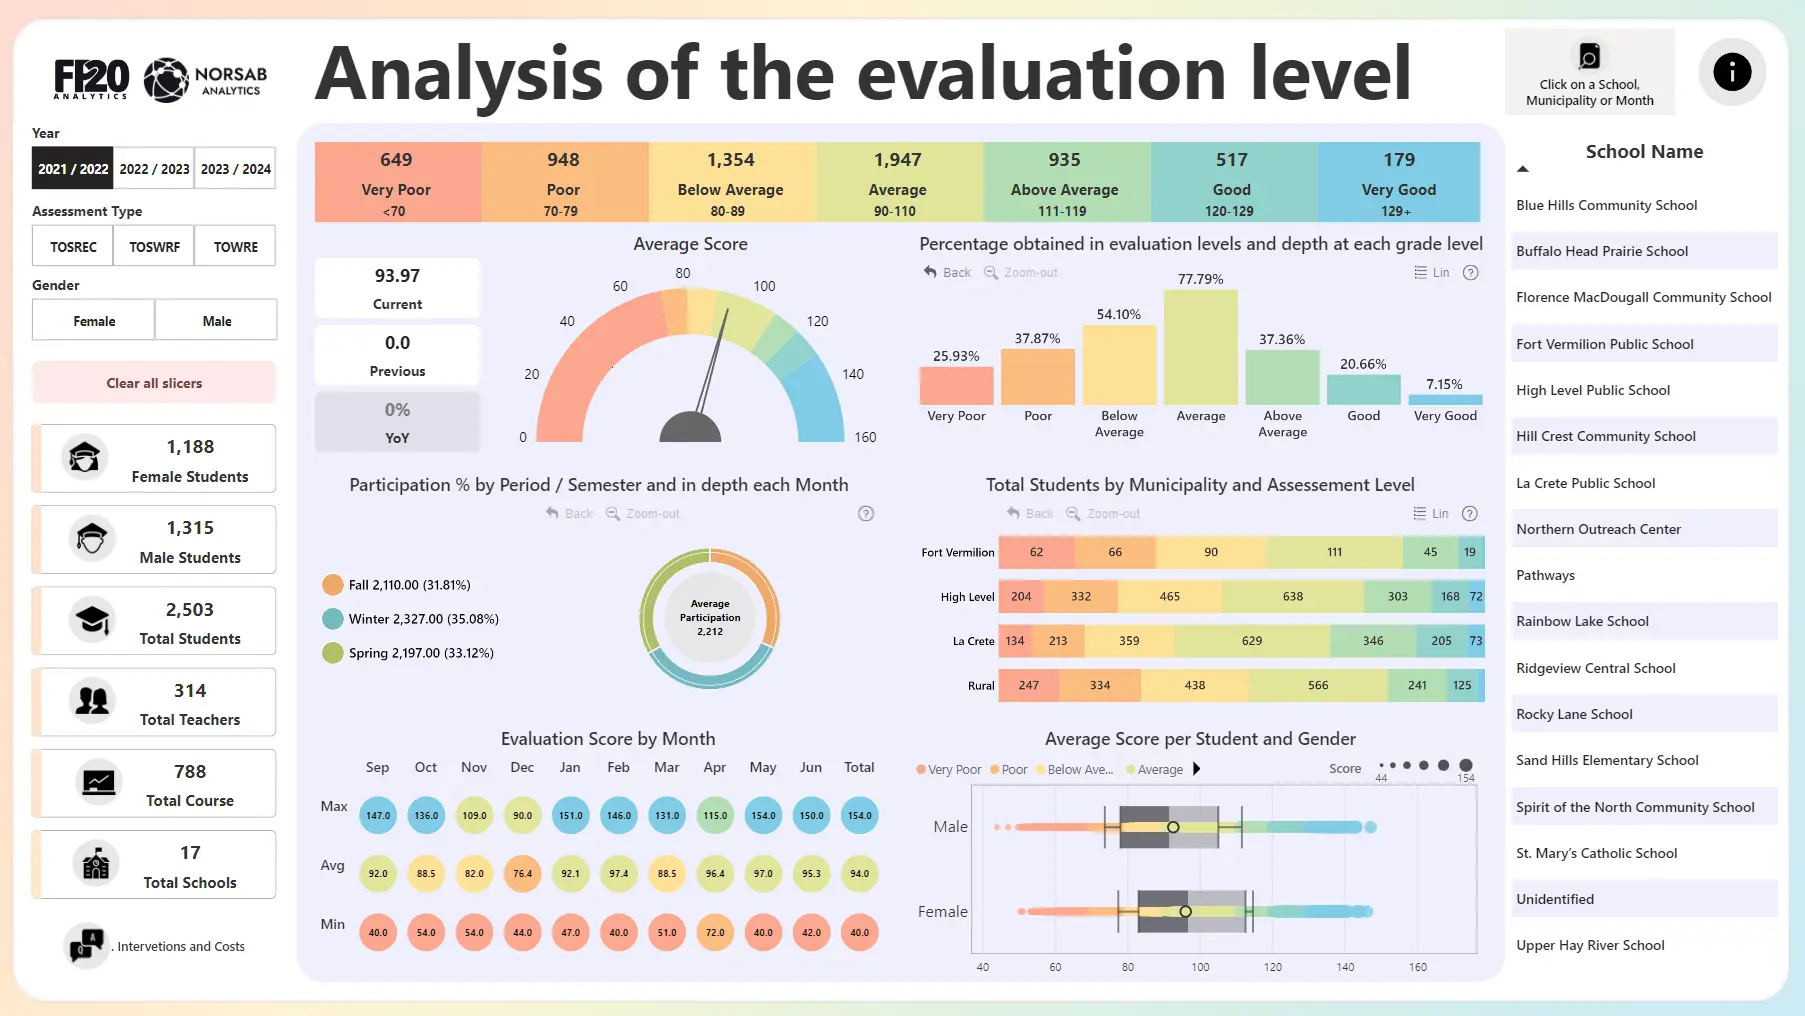
This school analytics Power BI report provides an all-encompassing overview in the initial view, while allowing the user to quickly […]
-
18 Christmas Gift Power BI Sales Dashboard
How To Use This Report Template To interact with this Power BI report, simply click any active elements directly on […]
-
19 Spotify Top Artists & Trends Report
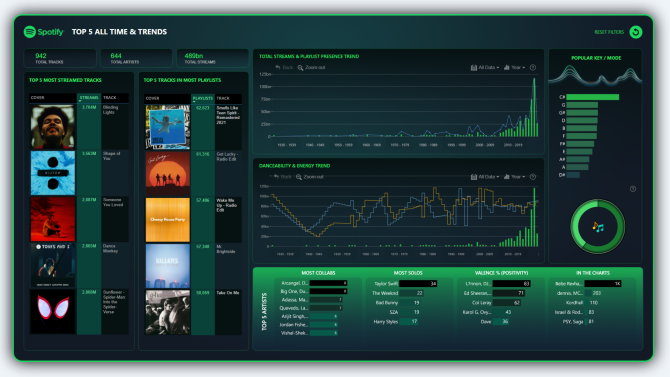
The report places a visual emphasis on the most listened artists and songs, supplementing it with insights on relation between […]
-
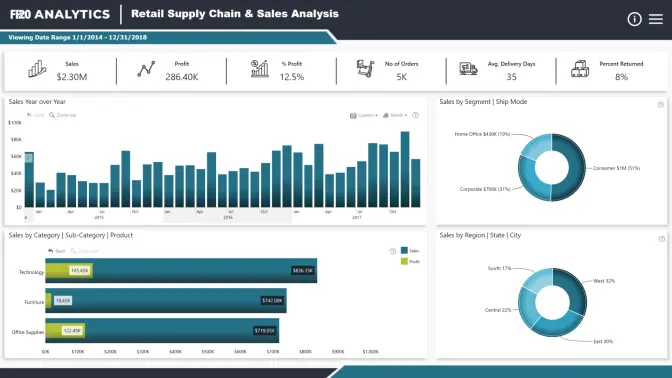
20 Retail Supply Chain and Sales Analysis
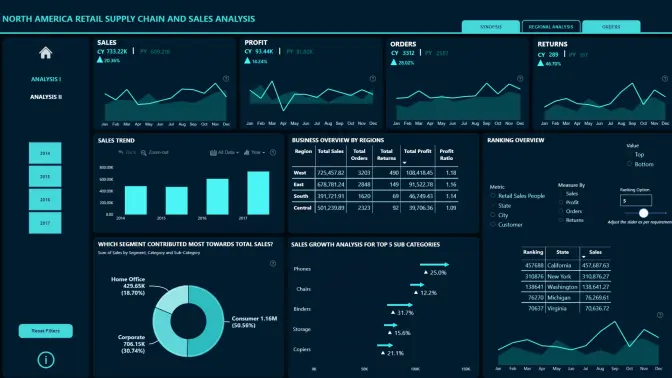
How To Use This Report Template To interact with this Power BI report, simply click any active elements directly on […]
-
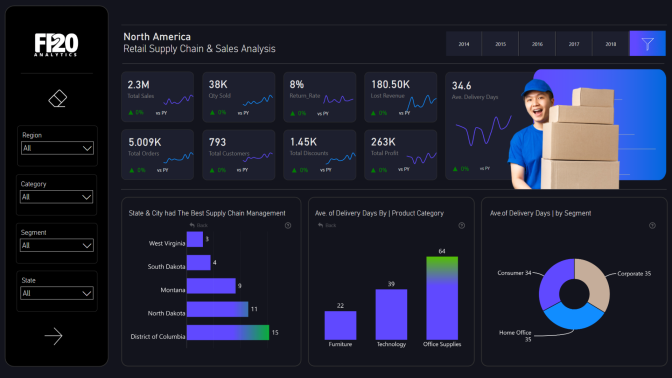
21 Retail Supply Chain Management & Sales Analysis Report
How To Use This Report Template To interact with this Power BI report, simply click any active elements directly on […]
-
22 Retail Supply Chain & Sales Dashboard
By combining a striking visual style that catches the user’s eye and a thoughtfully placed collection of KPI cards, this […]
-
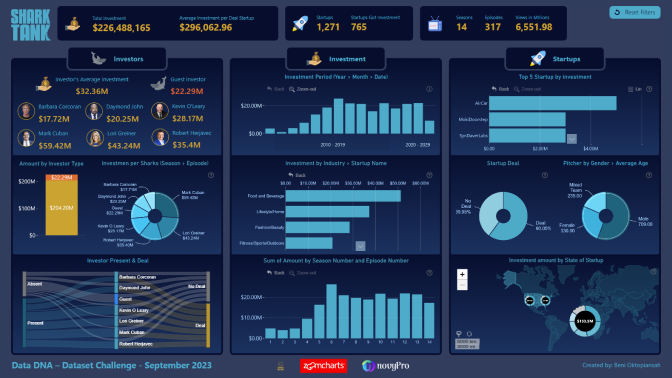
23 Shark Tank Analysis
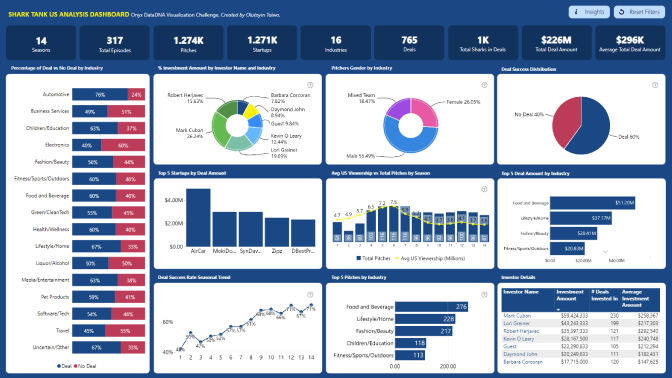
How To Use This Report Template To interact with this Power BI report, simply click any active elements directly on […]
-
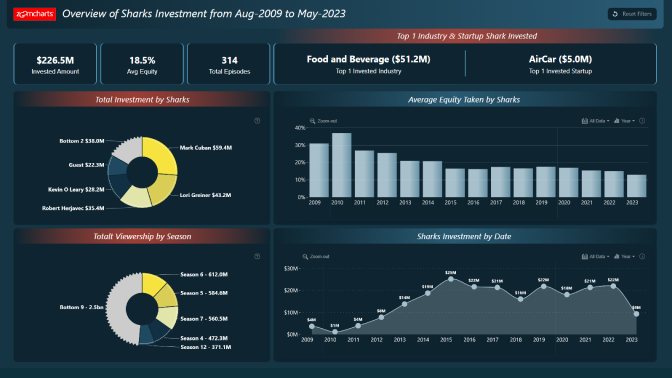
24 Shark Tank Analysis
How To Use This Report Template To interact with this Power BI report, simply click any active elements directly on […]
-
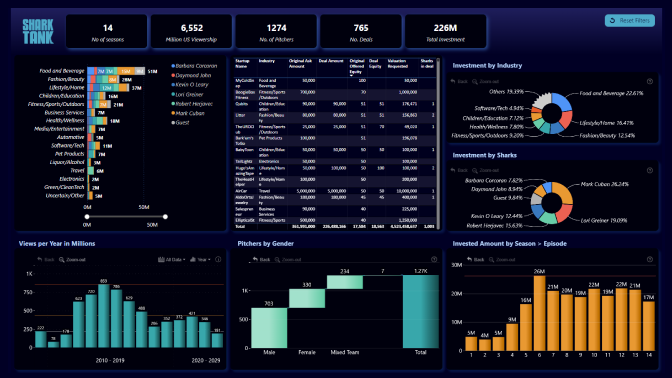
25 Shark Tank Analysis
How To Use This Report Template To interact with this Power BI report, simply click any active elements directly on […]
-
26 Shark Tank Analysis
How To Use This Report Template To interact with this Power BI report, simply click any active elements directly on […]
-
27 Budget vs Actual Sales
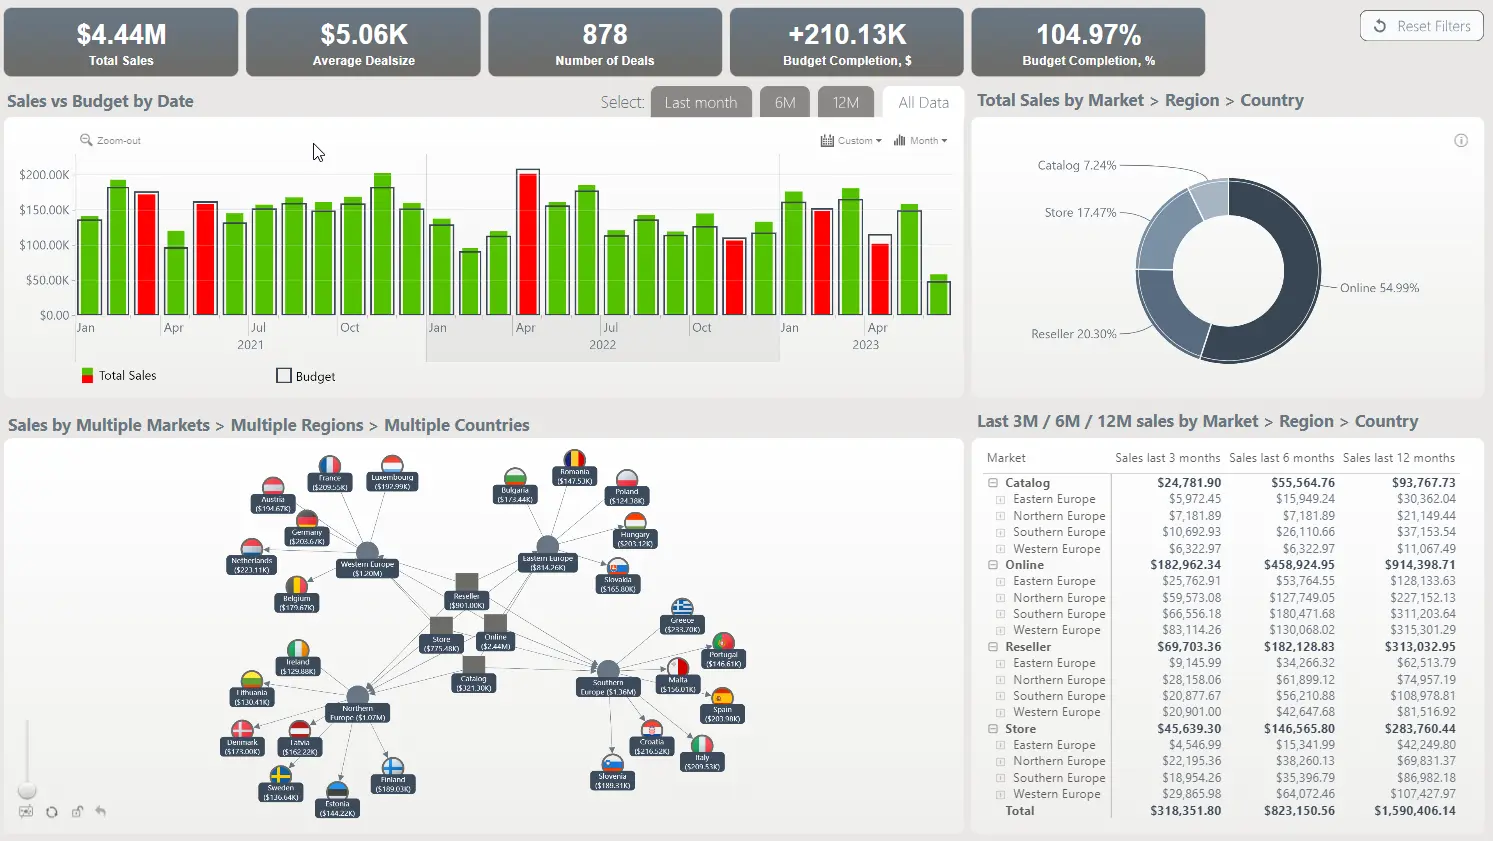
With this Power BI report template, you can compare sales and budget by date and see trends over time with […]
-
28 Employee Turnover Report
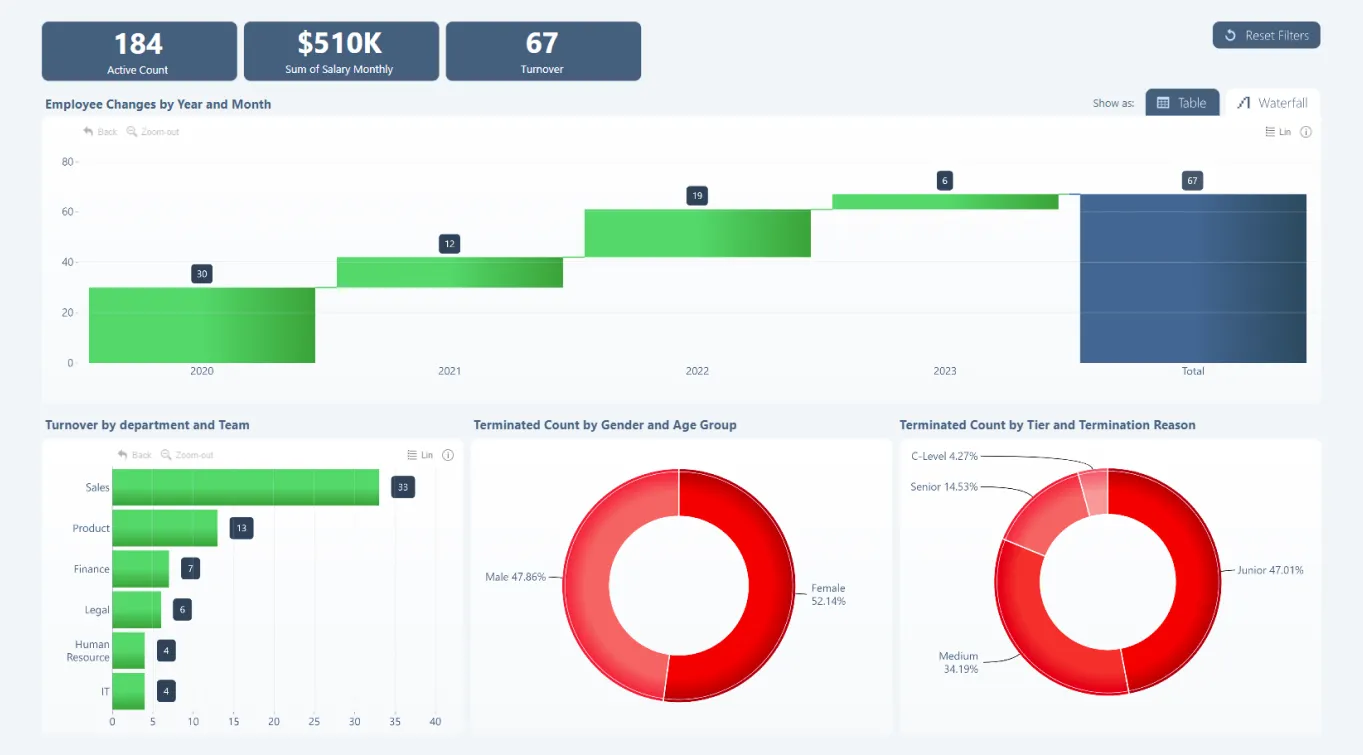
Summary This Power BI dashboard template displays Employee Turnover and can be used to analyze and track the rate at […]
-
29 HR Workload Overview Report
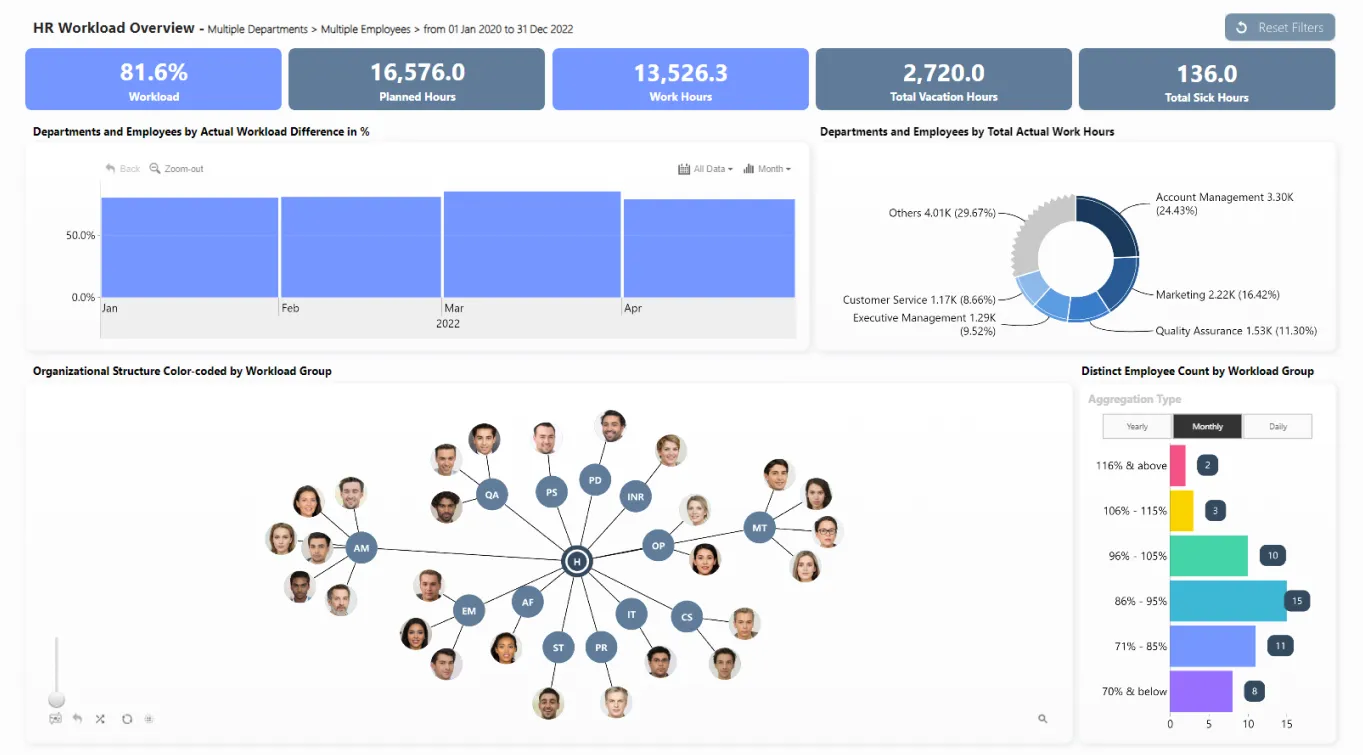
Summary This Power BI dashboard template displays an HR Workload Overview. Built with Drill Down Visuals which feature on-chart interactions […]
-
30 Annual Recurring Revenue Report
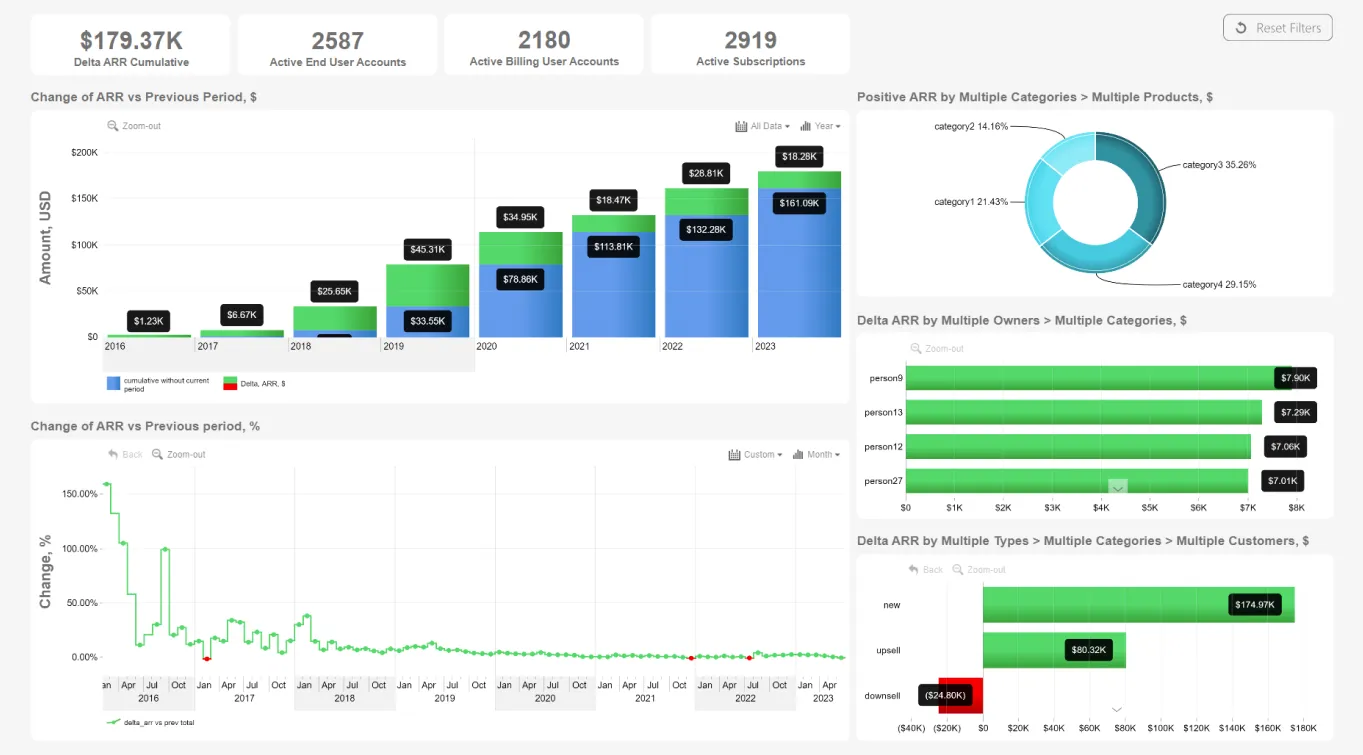
Summary This Power BI dashboard template depicts annual recurring revenue for multiple products. Comprised of Drill Down Visuals which feature […]
-
31 Inquiry Analysis
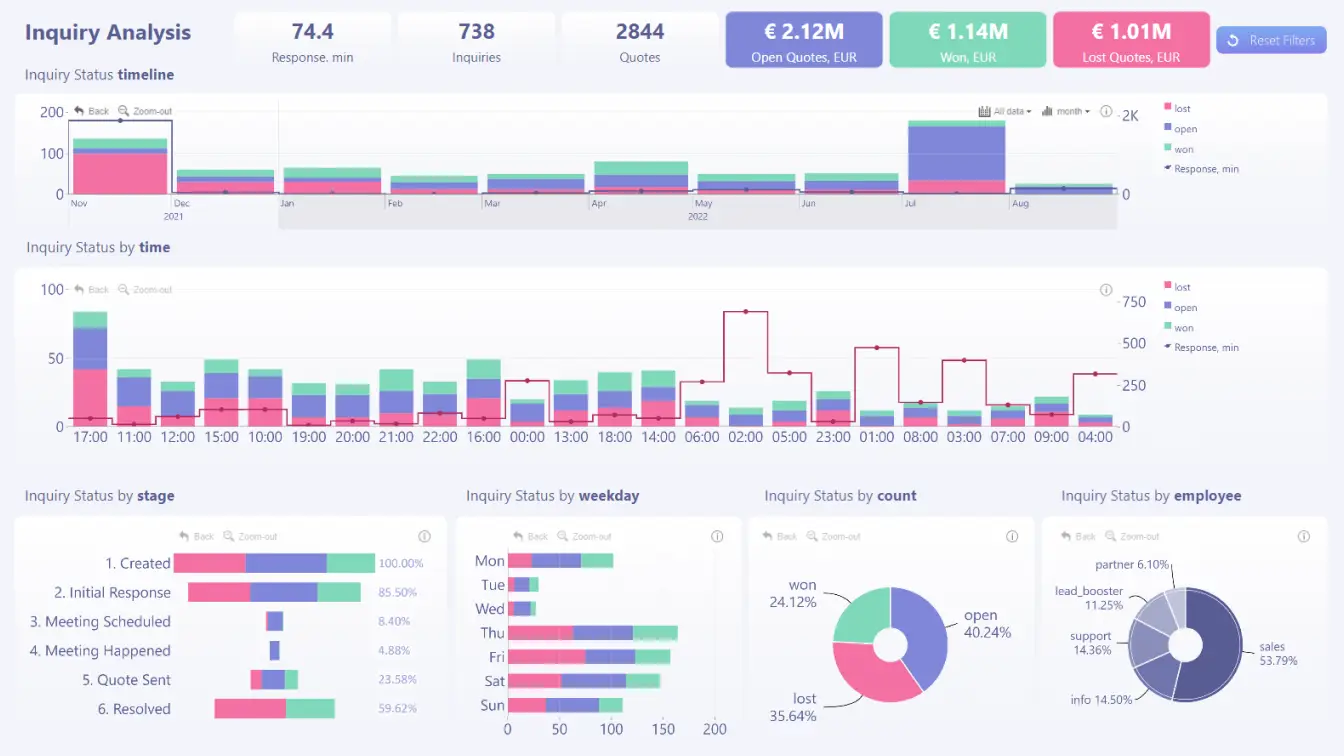
Summary Perform a thorough inquiry analysis with this Power BI customer dashboard template! Easily monitor won, open, and lost inquiries – […]
-
32 Debtor Analysis
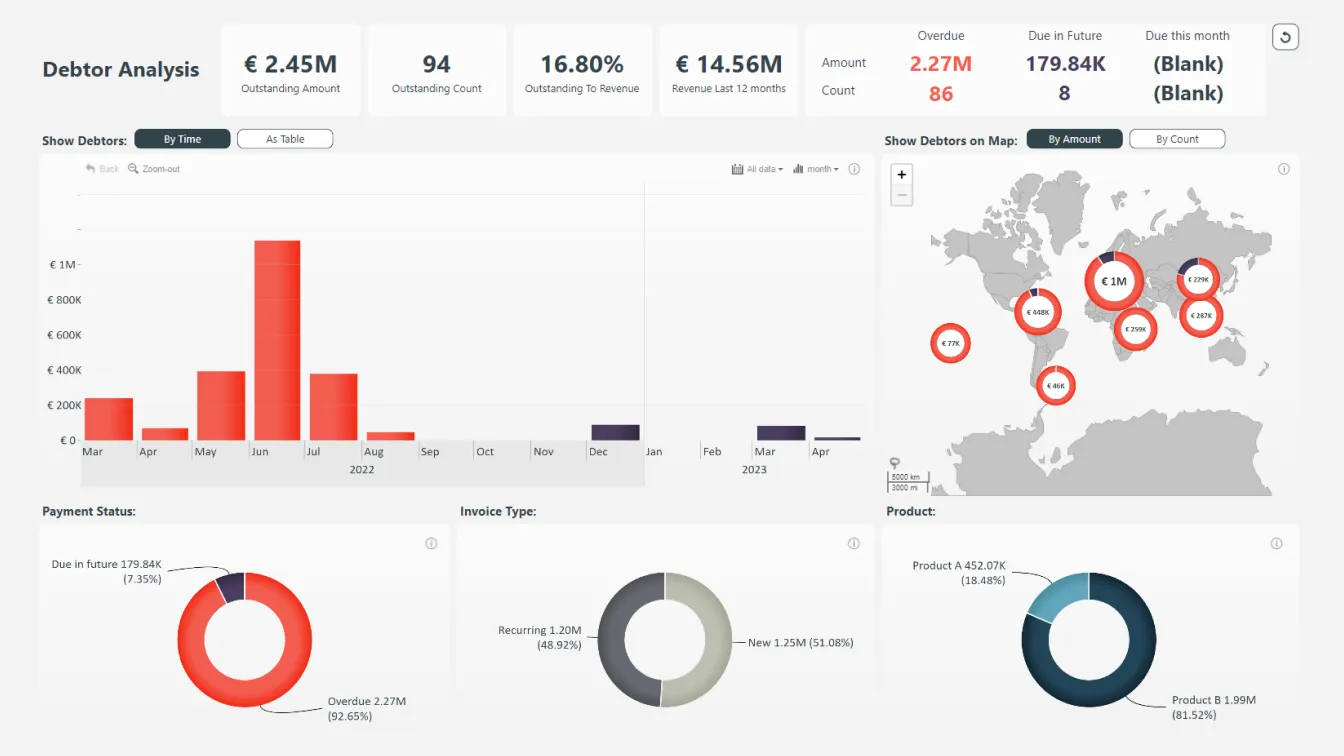
Summary Perform a thorough debtor analysis with this clean and intuitive KPI dashboard for Power BI! The KPI cards give […]
-
33 Revenue vs Budget
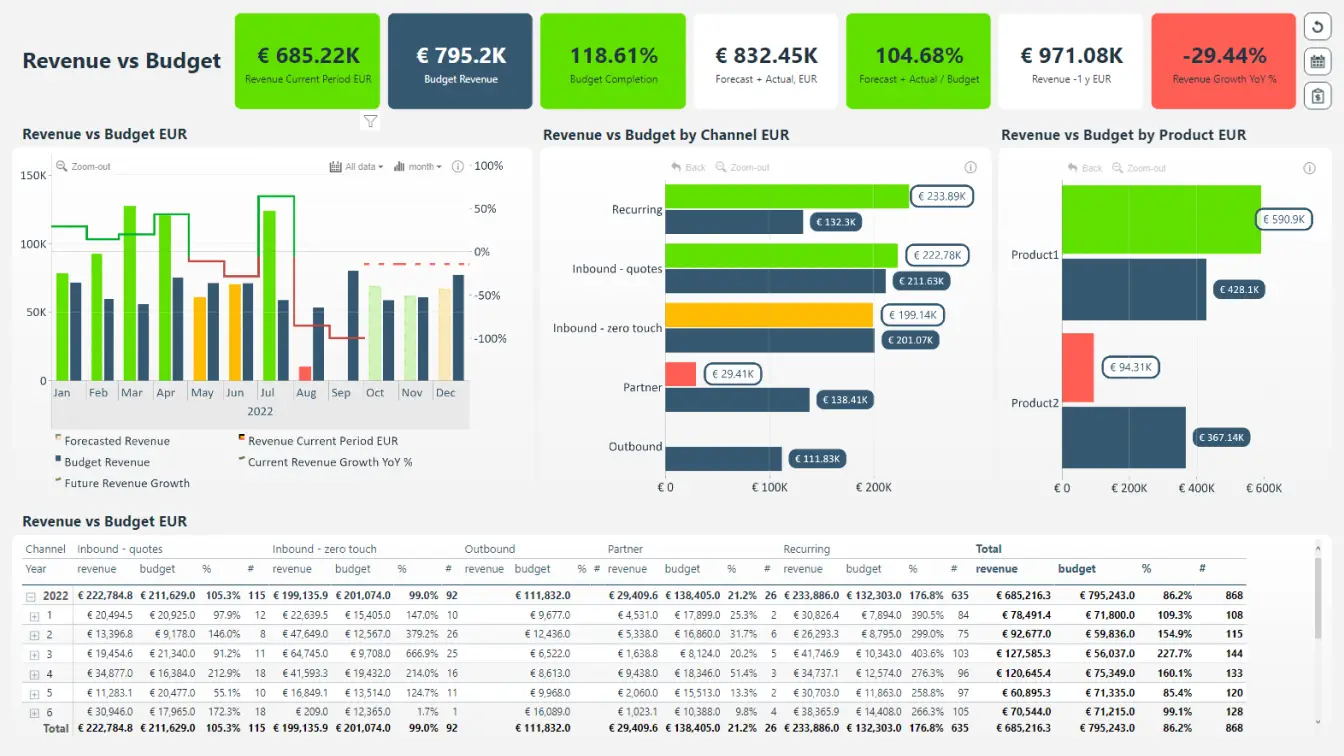
Summary Gain a data-driven edge for your business with this free Power BI Budget vs. Actual dashboard! Visualize, analyze and […]
-
34 Invoice Explorer
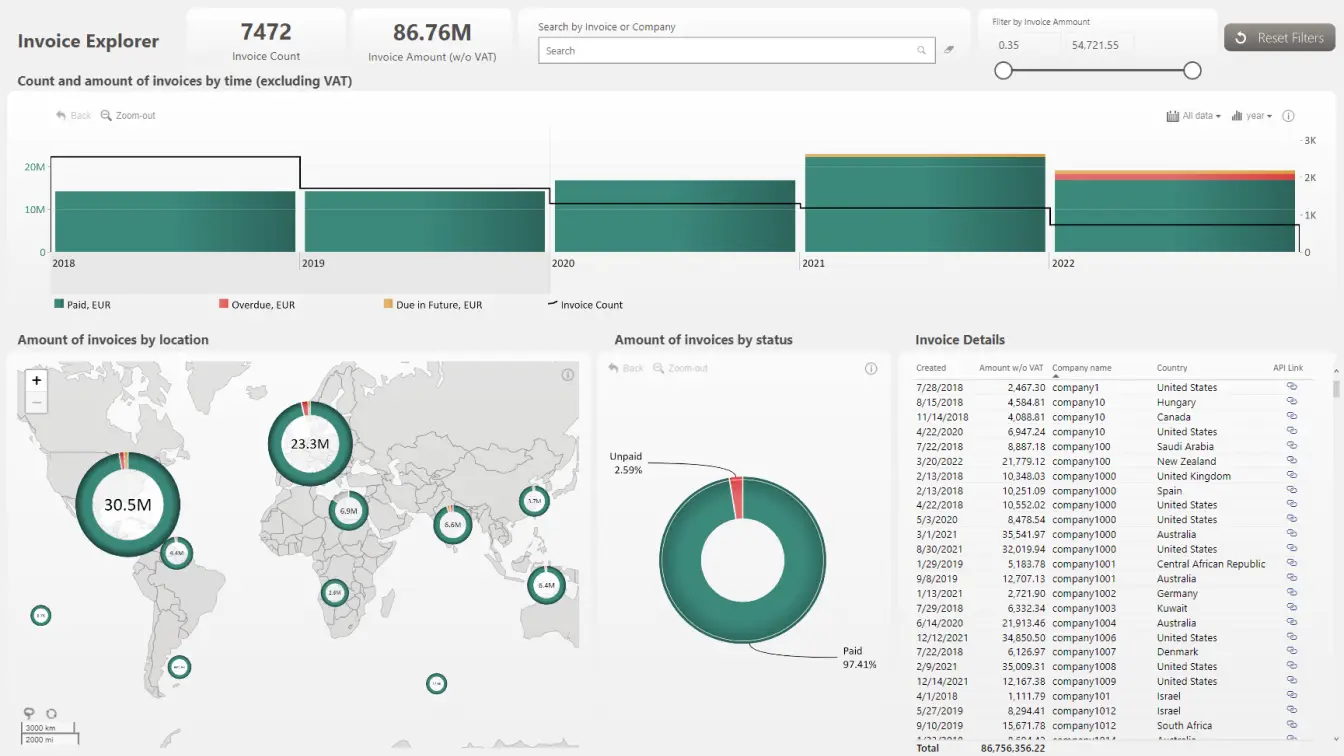
Summary With this Power BI accounting dashboard, you’ll be able to easily see the total invoice count and identify paid, […]
-
35 Sales Conversion Report
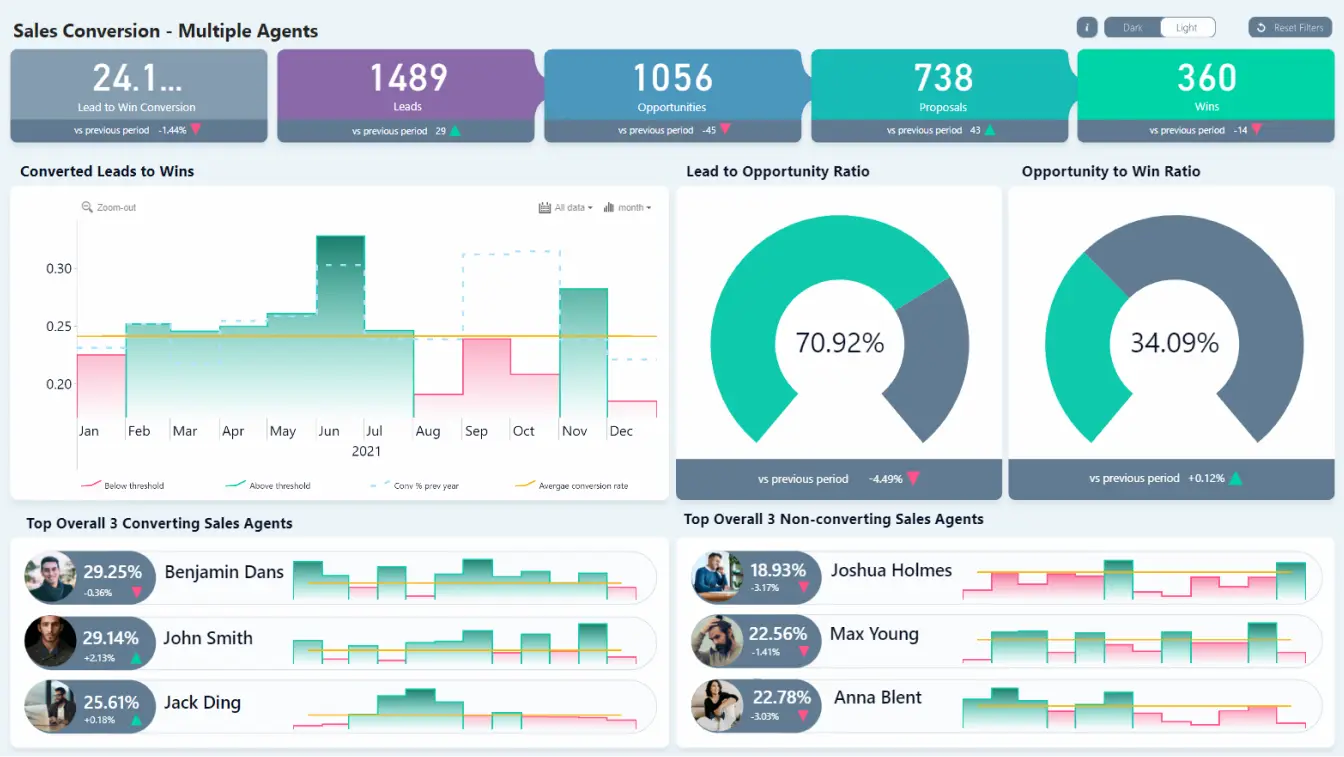
Summary This Power BI sales analysis template is tailor-made to visualize your sales conversion data. With a quick glance, you […]
-
36 Sales Overview Report
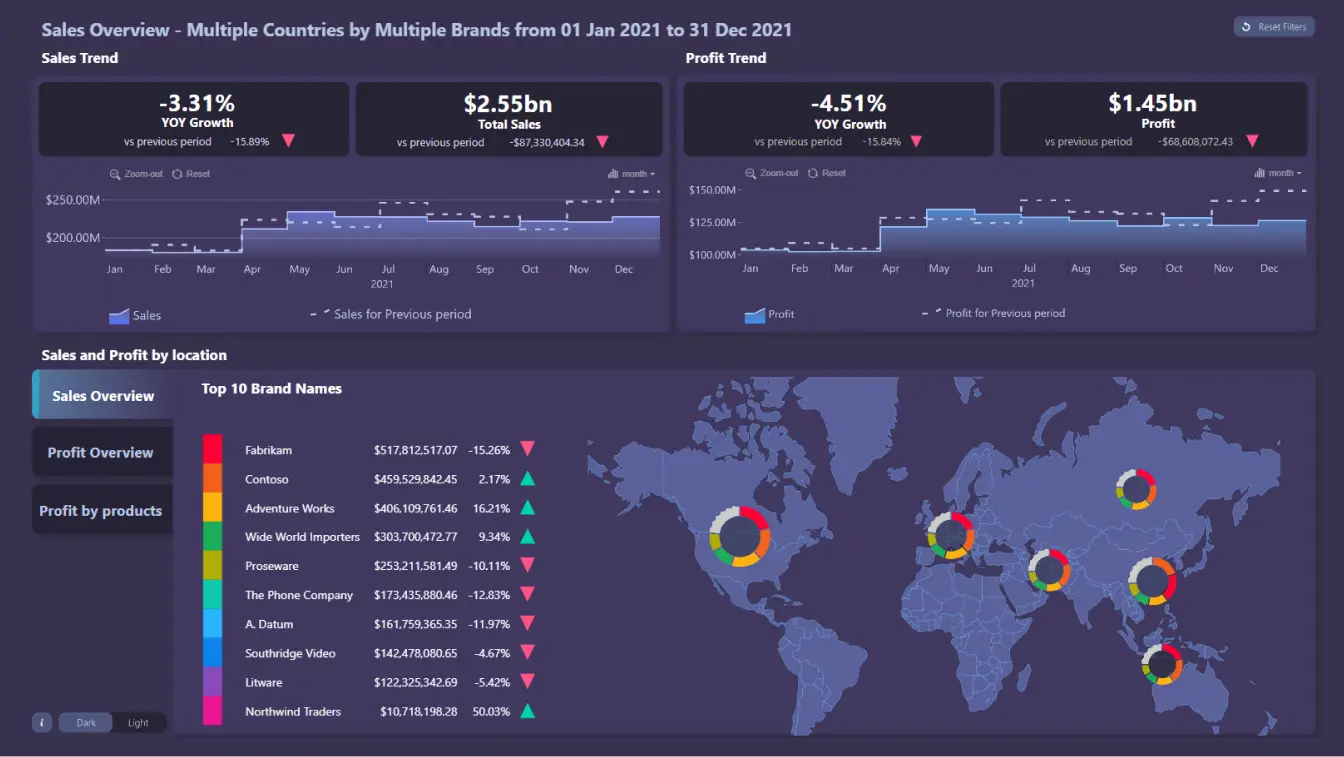
Summary This Power BI executive dashboard depicts various essential aspects of sales data in a single report page, letting you […]