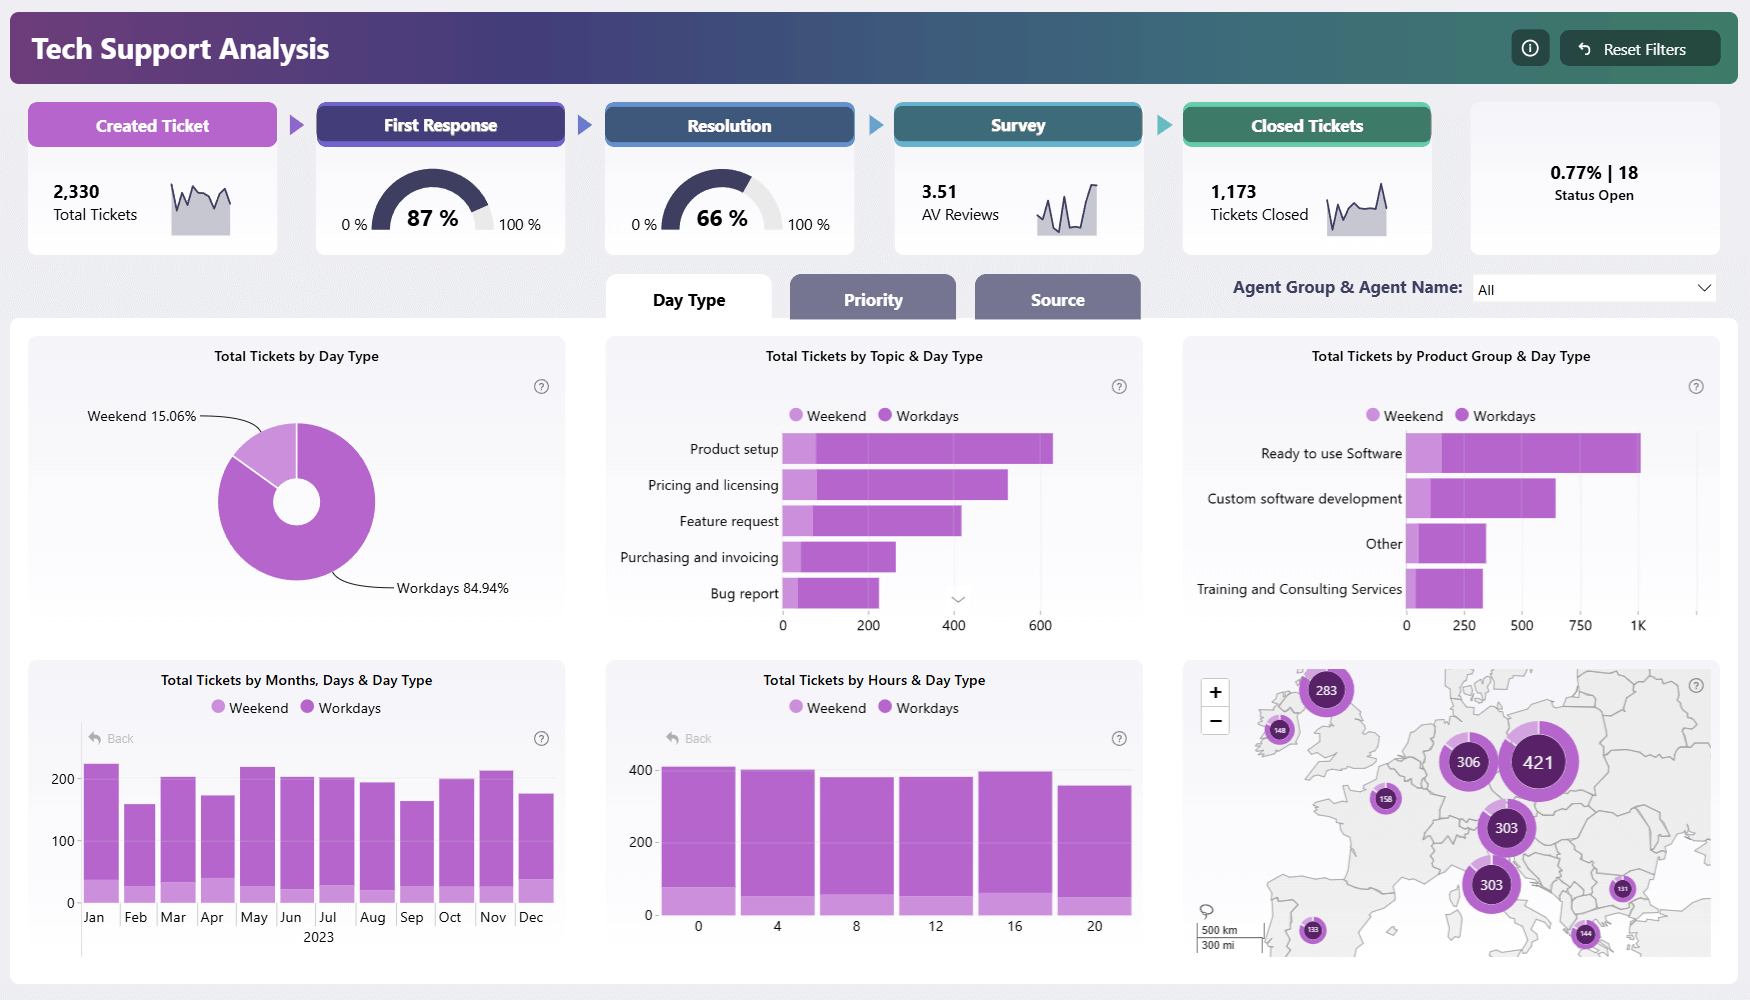
Key Metrics of This Report
This Power BI service dashboard provides insights about various performance metrics, including:
- Trends in ticket volume
- First response speed vs. SLA rate
- Ticket resolution speed vs. SLA rate
- Peak times and locations
- Customer satisfaction rate.
You can filter data to a specific helpdesk agent with a handy slicer
Leave a Reply